- Trading Advice for Losers
- Posts
- $30K In 3 Weeks of Momentum Trading.
$30K In 3 Weeks of Momentum Trading.
Trading high pre-market volume bears fruit
Mo Wright
June 09, 2025
⭐ Join our subscriber community at mwright.com ⭐
Introduction
Welcome back. In this issue we’ll get to review the impact of trading 1 Day Rockets daily. It hasn’t been perfect, but it’s not nothing. We’ll also do a quick review of last week’s stock picks and introduce a few new ones.

My First Strawberry
The above image is the first strawberry in my garden. It’s also the very first fruit I grew with my own two hands. One of our backyard visitors ate it, and they have continued to do so with every ripened strawberry since then. So, I still don’t know what they taste like. 😕
This has nothing to do with anything else in this article other than the fact that maybe we don’t always get to reap what we sow. But, the work is, nonetheless, rewarding.
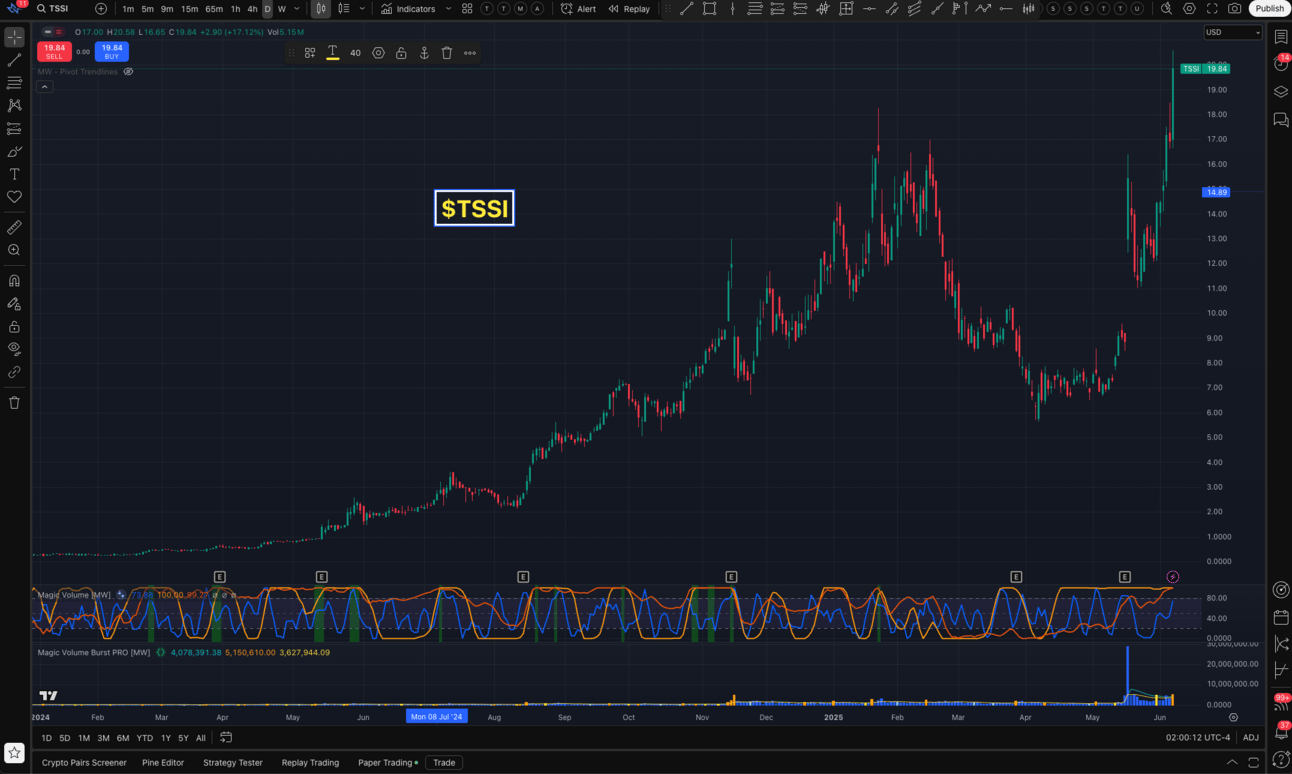
We have some new stocks that came in to our new 100 Baggers screener. $TSSI in particular has been consistently growing its return on equity (ROE) for the past few quarters and has recently broken its all time high and continues to have significant volume.
The performance of our last set of stock picks starting from 5/27/2025 is currently at +7.03%, compared to +2.23% for $SPY and +6.26% for $UPRO (triple-leveraged $SPY). 3 of the stocks are up over 20% ($BYRN +28.91%, $LEU +23.57%, $SEZL +22.06%).
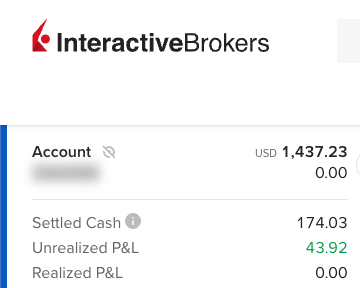
Now, I wish I had bought more than $1400 worth. Also, although only 2 of the stocks are negative (the lowest, $CASH, being down -0.33%), I had my STOP orders triggered at -$10% on 2 of the stocks, which hurt my overall performance by taking about $30 off of the profit & loss statement. But, even with those drawdowns, I’m still beating the S&P 500 with a nearly 3% gain.
$30K in 3 Weeks of Momentum Trading
Over the last few months I’ve been trying to figure out how to trade 1 Day Rockets (see previous newsletters 1 Day Rockets and 1 Day Rockets Part 2) in a long direction (betting that the price will go up). It’s a lot like trading options and futures in that it is entirely possible to get a 10%, 20%, or 100% or more gain in one trade.
With a typical large cap stock (S&P 500 or Dow Jones Industrial Average equities, for example), moves of +/- 1-5% are typical. 10% moves are uncommon, but happen occasionally. 20% moves are rare. With 1 Day Rockets, giant moves happen every day, and throughout the day.
I was pretty successful paper trading them short (betting the price would go down), but there are a lot of limitations when you trade short in the real world. The end goal is to be able to reliably trade on a live account, which means that trading long is the way to go, and requires a lot less money.
I couldn’t quite get the hang of trading long, though, and wiped out a $100K simulated account that I had gained $40K in using a short trading strategy. But I think I finally figured it out. A good entry is heavily dependent on rising volume. If the cycle of volume is not going up (measured with stochastic volume) and the volume on the current bar isn’t higher than the last one, then don’t expect anything good to happen.
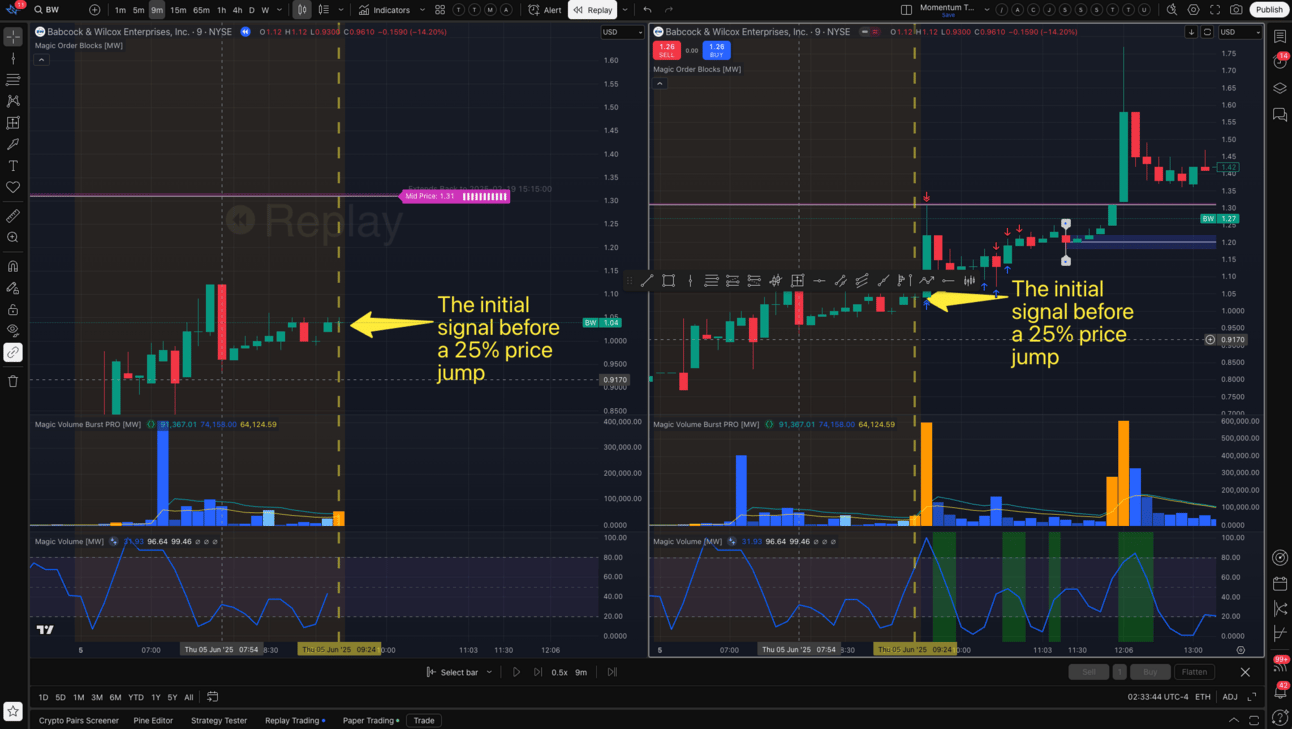
Magic Volume Oscillators PRO [MW], Magic Volume Burst PRO [MW], and Magic Order Blocks [MW] used to generate signals
On the constructive side, if the cycle of volume begins to rise, and the volume of the current bar becomes higher than the last volume bar - well before the bar’s time expires, then you have a good candidate for a long entry. Again, this only applies for stocks filtered through the 1 Day Rockets criteria of mid-cap stocks with high pre-market volume, and has retained most of its price movement by market open.
For exiting a trade, if a candidate is trading under the Volume Weighted Average Price (VWAP) when an entry signal hits, then I’d use VWAP for the exit and the bottom of the last consolidation zone for the stop-loss. If it’s trading above VWAP, then I’d use the next Magic Order Block [MW] level, or the midpoint of the highest previous candle wick, and use the VWAP as the stop-loss.
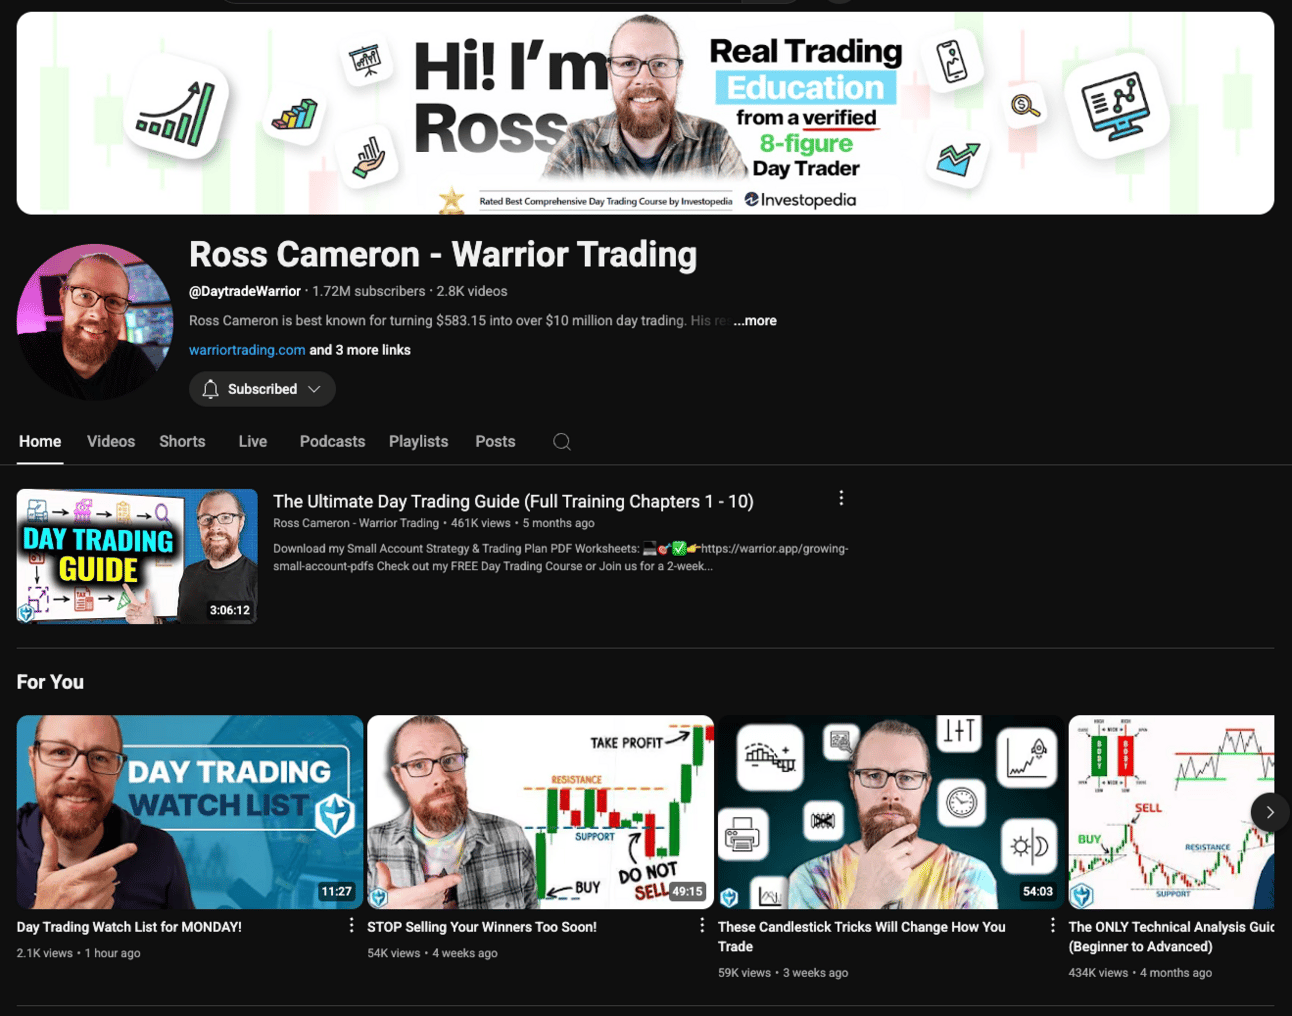
@Ross Cameron - Warrior Trading on Youtube
As I was trying to nail this strategy down, I came across two Youtubers that trade in similar ways: @Ross Cameron - Warrior Trading and @Treyding Stocks. Ross Cameron shows his trades daily after his trading day is over. He gives a relatively good description of what he did, but doesn’t really talk about how he finds the stocks that he trades. His trading days commonly include +$100K profits, with maybe 1 or 2 losing days - per month. Trey, from @Treyding Stocks, on the other hand is all about transparency. I came across his channel, because he has some of the best videos on how to set up the ThinkOrSwim trading platform for day trading.
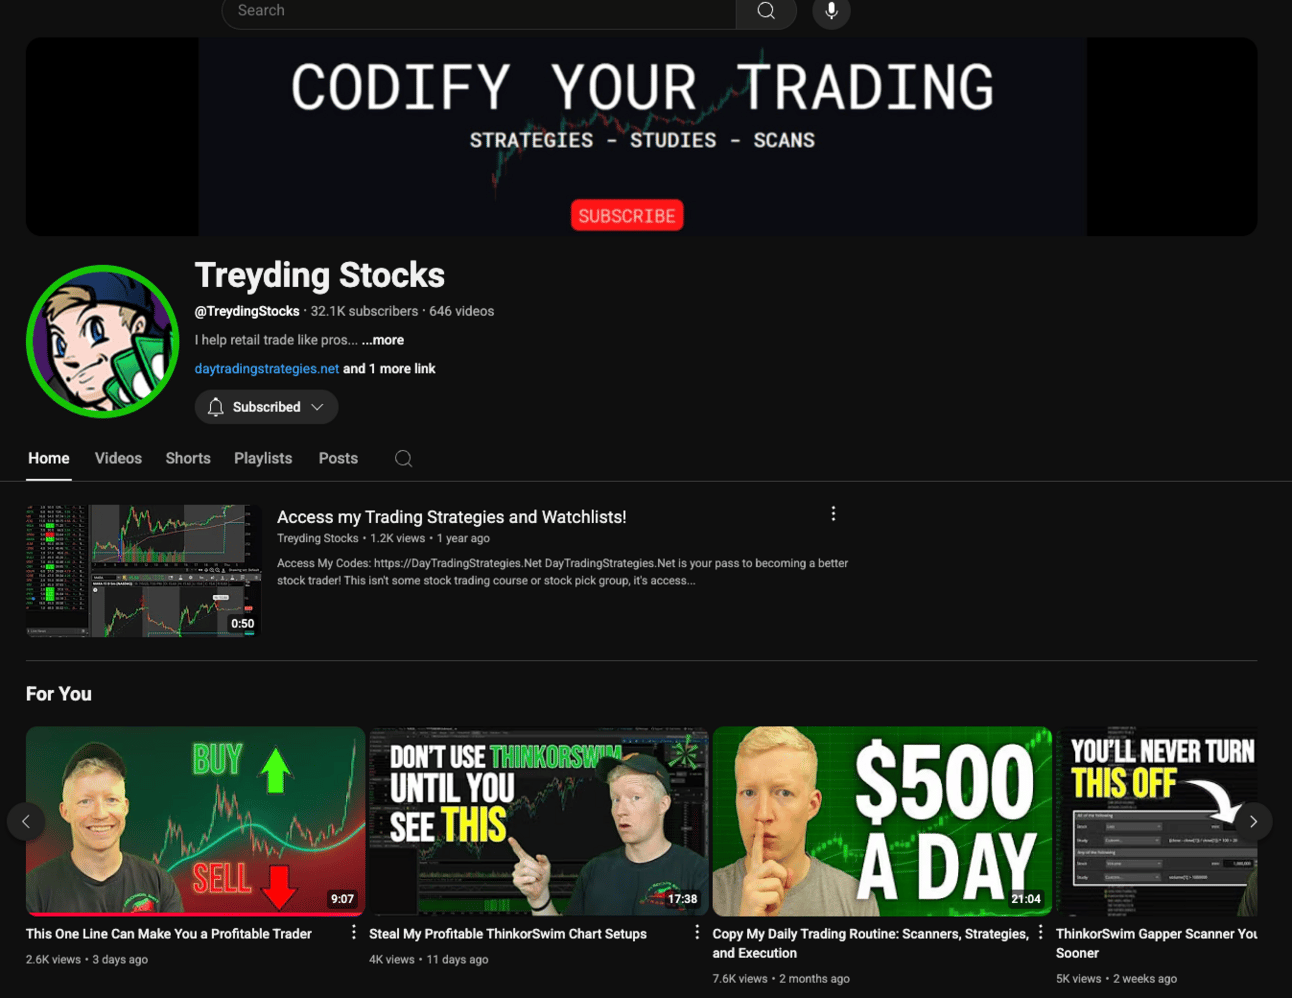
@Treyding Stocks on Youtube
The @TreydingStocks channel had a tutorial on how to set up a ThinkOrSwim scanner to find the same types of stocks that Ross Cameron trades called “Warrior Trading’s $1M Momentum Scanner (Free in ThinkOrSwim)” I used his instructions, but found that it didn’t really line up with what Ross was showing on a daily basis. My 1 Day Rockets TradingView screener seem to match more closely. However, Trey’s scanner did provide some great stock picks for trading this type of momentum strategy. I highly recommend watching the video.
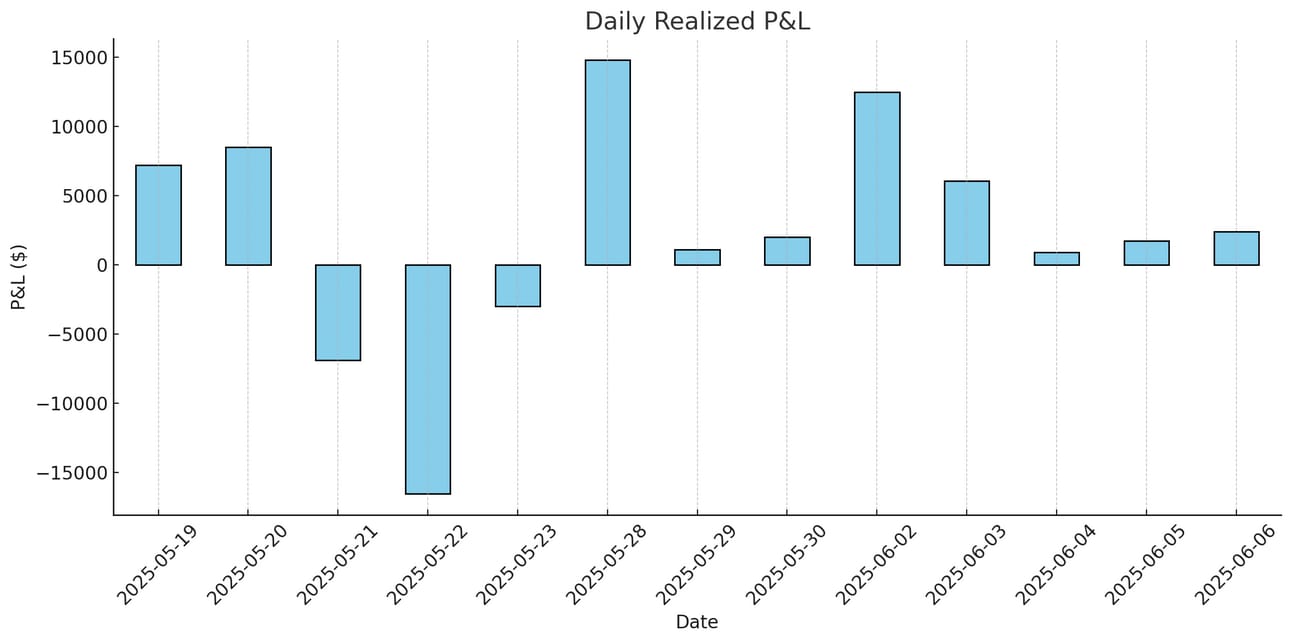
The Results:
📊 Trading Summary
Total Trades: 39
Total Realized P&L: $30,751.82
Winning Trades: 22
Losing Trades: 15
Break-even Trades: 2
💰 Profit/Loss Details
Average Winning Trade: $3,510.99
Average Losing Trade: $-3,099.33
🏆 Best Trade
P&L: $14,770.00
Time: May 28, 2025 @ 07:37:16
Details:
Closed long position for NASDAQ:ASBP at $0.6553 for 100,000 units (Entry: $0.5076)
💥 Worst Trade
P&L: $-9,500.00
Time: May 22, 2025 @ 06:45:33
Details:
Closed long position for NASDAQ:BDRX at $1.58 for 50,000 units (Entry: $1.77)
The strategy is by no means perfect, but I have been able to improve it by clearly identifying what defines a good exit, which could only come from actually placing trades. This can be more clearly seen in the fact that in the paper account, I’ve had 8 green days in a row.
Also, I built a new TradingView Indicator to help identify entries - Magic Volume Burst PRO [MW]. It will be available soon on TradingView. It color codes volume bars based on whether volume has jumped significantly while the volume cycle is on the upswing, or if the volume cycle has pivoted upwards with a good jump in volume. It also has alerts for each type of volume event. It will require a subscription to access it, but it will be free for current members of the mailing list.
Next week, I’ll begin live trading the strategy in ThinkOrSwim. Since I added the new indicator, trading this strategy has become even more reliable. Hopefully, I’ll get the same performance in a live environment. Fingers crossed.
More Resources
Free tools that you can use today to improve your trading
Free TradingView indicators you can use right now in your account. Don’t have a TradingView account. Click this link to get one.
The End
If you like this newsletter, let me know, and please share. If you don’t like it, please tell me why, and I’ll do my best to make it better. And remembre, if you have any questions, feel free to reach out to me on Reddit, X.com, TradingView, or Youtube. If for some reason you forget, you can always get those details from the footer at mwright.com