- Trading Advice for Losers
- Posts
- 1 Day Rockets
1 Day Rockets
Using The TradingView Screener to Find Moonshot Stocks
Mo Wright
March 08, 2025
⭐ Join our subscriber community at mwright.com ⭐
Introduction
Welcome back. In this issue we’ll be reviewing a topic that has garnered a lot of attention in my Youtube Channel, MWRIGHT TRADING, 1-Day Rockets. Stocks that have potential for large 1-day moves. We’ll also be reviewing $SPY, and its triple inverse partner $SPXU by association.
I am not an expert, and you should not treat any of what is said in this newsletter as financial advice. It’s just my opinion. The opinion of an average trader that has had some success, and many failures.
What makes my opinion different, though, is that I’ve spent the last two years coding trading indicators and strategies full-time to supplement my own trading. And, I’ve been building apps and websites since the browser was invented.
You can access all of the tools that I’ve built at https://mwright.com. Indicators. Calculators. Strategies. Browser extensions. Etc.
Stock of the Week: $SPXU
This is a triple-leveraged ETF that does the inverse of the S&P 500 ($SPY), times 3. Later on in the newsletter I go into why I have a bearish view on $SPY
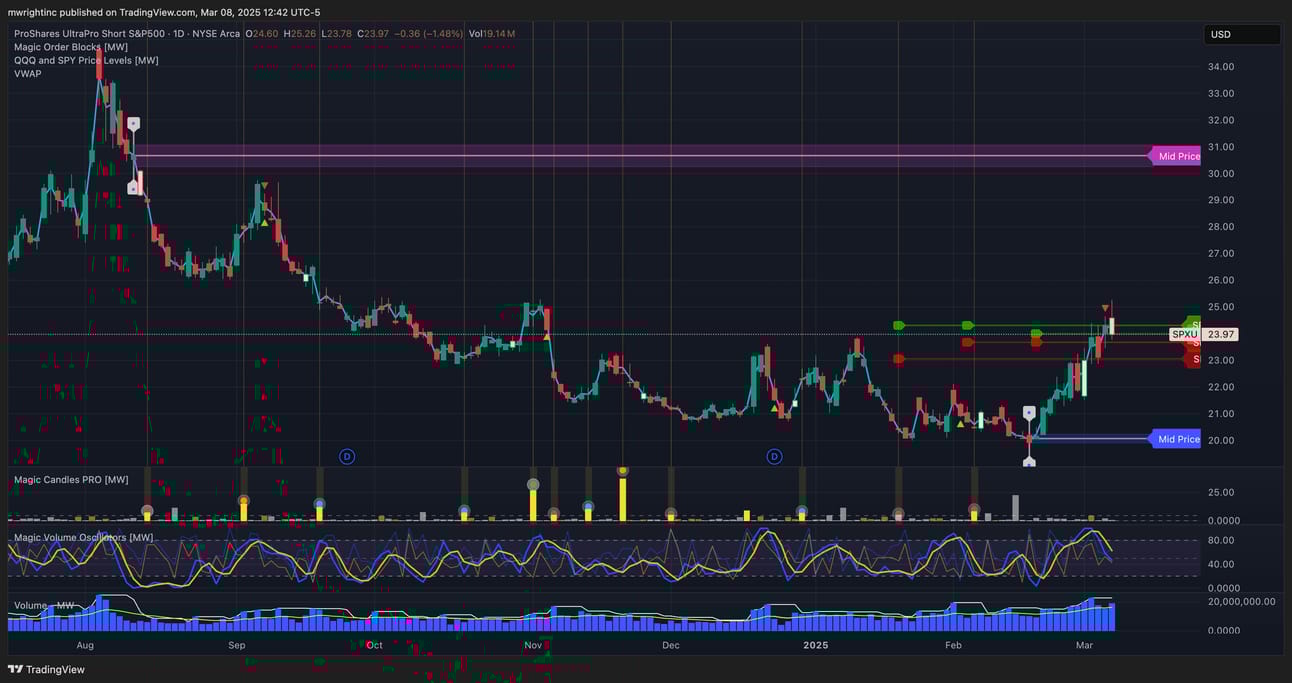
$SPXU 1D With Magic Order Blocks [MW], Magic Candles PRO [MW], and QQQ and SPY Price Channels
1 Day Rockets
A couple of months ago I saw a post by @1215daytrading on the r/Daytrading subreddit titled “I’ve been trading for over 12 years and THIS is one of my best strategies”. A very intriguing title. It describes in detail what you need to look for when selecting a stock.
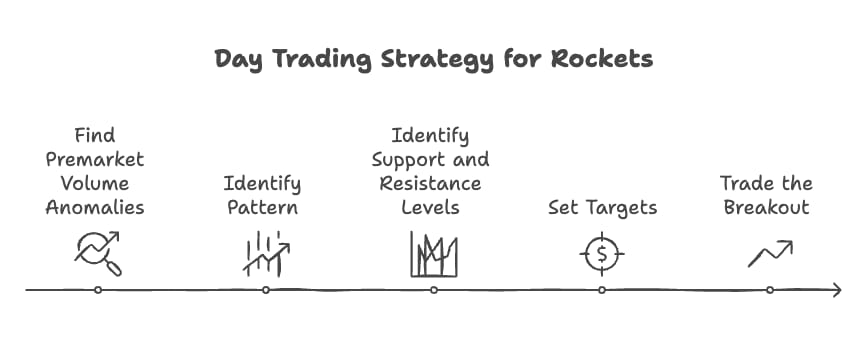
Here is the process in a nutshell:
Find Premarket Volume Anomalies: Scan for stocks with 1M+ premarket volume approaching/exceeding their highest historical volume day.
Identify Pattern: Look for strong initial rise followed by a single major consolidation period.
Identify Support and Resistance Levels:
Resistance: Premarket high
Support: Bottom of consolidation
Set Targets: Target price = Premarket high + (Premarket high - Consolidation bottom) Example: $2.50 high, $2.00 bottom → $3.00 target
Trade the Breakout: Enter on break above premarket high with confirmation.
Key Criteria
Premarket volume near/above historical high
Single consolidation pattern
Clean chart history
Unbroken consolidation at market open
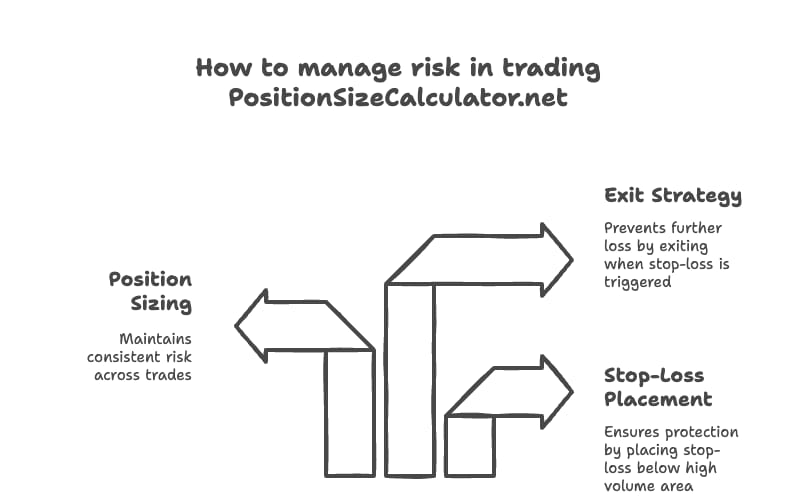
Risk Management
Place stop-loss below highest volume area
Size positions to risk consistent amounts
Exit if stop-loss triggered
This was interesting enough for me to make a TradingView Indicator that could as closely follow this guidance as possible. I shared the screener details back in the subreddit, but found that I must be a TradingView power user, because no one else could figure out how to create the settings in TradingView.
So, I made a video about it called “1 Day Rockets - Using The TradingView Screener to Find Moonshot Stocks” where I showed people how to add new filters on the TradingView Screener that are otherwise very hard to find. I’ve attached an animated gif version in this newsletter. But, you can always check out the video.
The criteria I settled on was
Market cap 0 to 2 B USD - To use just small to mid cap stocks
Avg Volume 90D < Pre-market Vol - Make sure pre-market volume - ALONE - is greater than the average volume of every full day for the past 90 days
ATR (14) 0% to 20% - By having the current Average True Range on the low side, it ensures that some type of consolidation is currently taking place
THE RESULTS
I’ve been watching these lists for the past few months. Using the Magic Watchlist Google Chrome Extension, which was designed exclusively for this TradingView feature, I could quickly go to a chart that has the Magic Order Blocks [MW] indicator for the 1 hour chart. When I did this, I found that
Some of the stocks trade very lightly (not a lot of volume) so their charts look scattered. Eliminate those.
The criteria does not exclude stocks where the big move was downward. For up moves, Eliminate those
Stocks that just reached a bearish order block during its move up will inevitably crash from there.
Stocks that move wildly in pre-market are seemingly unpredictable.
Stocks that move up, then settle down, like the OP (Original Reddit Poster) described may consolidate at a lower price than it’s consolidation range in pre-market, but about half the time, they will take off, like he said.
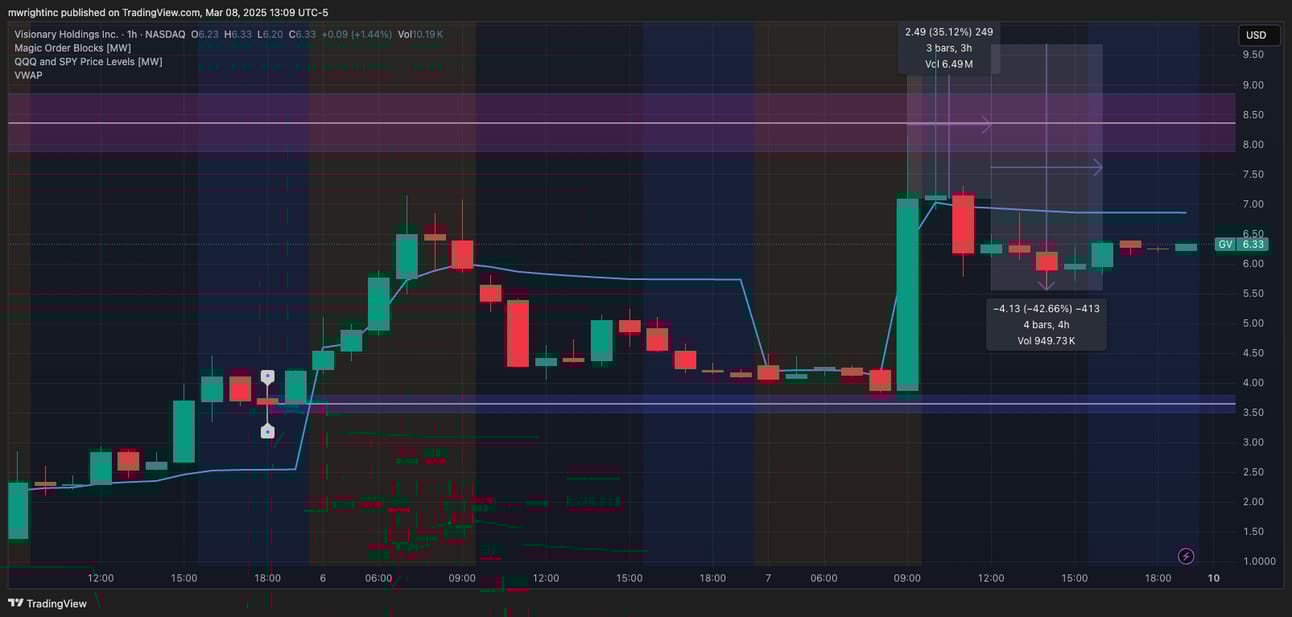
$GV - A 1-Day Rocket from Friday 3/7/2025 that saw a 38% move up from open and a 42% move down from its high. Falling back through an order block on the 1h timeframe
Then, I used the Position Size Calculator to define my Reward:Risk ratio. Ideally, you want to get in at the bottom of the consolidation period and put a STOP order just below that. The difference between your ENTRY price and your STOP price is your RISK. Or, it can be referred to as “1 Risk Unit”. With an ideal entry at the bottom of the consolidation period and an emergency exit just below it, should the stock make a big move up, you could easily make a 5:1 Reward:Risk ratio.
In fact, I did that a few times, but still lost the trade or broke even because I didn’t know where to set the TAKE PROFIT (TP), or exit price, because this strategy was so new to me. Also, the price would move very fast. If it’s not your only trade for the day, if you lose focus - or don’t have a TP amount - then you miss the exit and succumb to road rage.
I tried this trade a few times, and pretty much broke even. Mostly, because it wasn’t my primary trade, and I wasn’t paying close attention. I could definitely, see the potential in his method, but it was obvious that it was going to take more time to master his approach.
On another note, I did find that roughly 95% of all of the moves that I found (including the ones that were trading lower) all crashed and burned during some part of the day. Using the Magic Order Blocks [MW] helped with that, because it became clear, over time, that when many of the prices ran into overhead resistance in terms of an order block, they would almost always spike through, then fall from there. This made almost every play a candidate for a reliable short position. With those, I consistently did pretty good.
In summary, knowing how to use TradingView’s Stock Screener is invaluable. And, although, it is very powerful it can’t screen for everything. Combine that with
And, you can capture some pretty powerful moves. If you have any questions, feel free to reach out to me on Reddit, X.com, TradingView, or Youtube. If for some reason you forget, you can always get those details from the footer at mwright.com .
Free tools that you can use today to enhance your trading journey.
$SPY Analysis
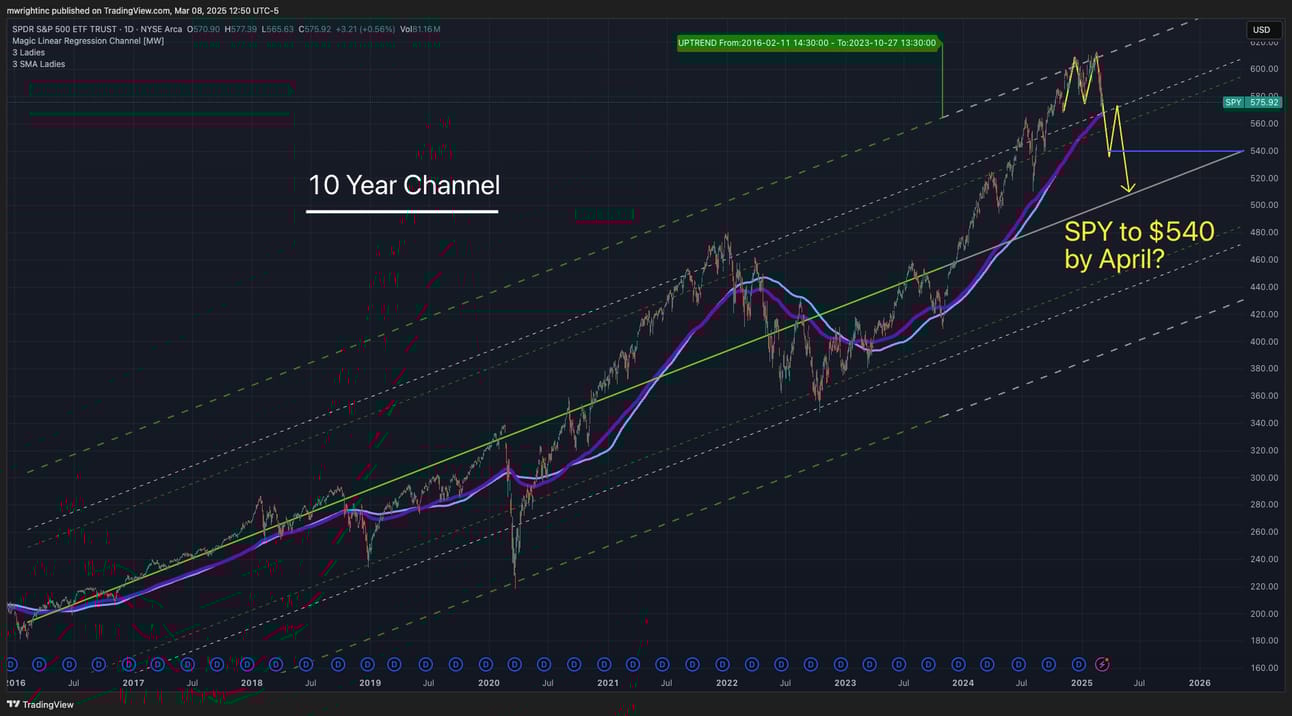
$SPY with 10-Year Magic Linear Regression Channel [MW]
A leading indicator for $SPY are indexes that feature the transportation ($DJT) and homebuilders ($XHB, $ITB) sectors. Because transportation represents the deliver of durable goods well in advance of many companies being able to book revenues from those received goods, when it goes up, it can predict the forward favorable, or unfavorable, expectations of major industry. The homebuilders indexes represent the expectation that a strong consumer market exists. Otherwise, there’s no reason to expect a profit from building new hew homes.
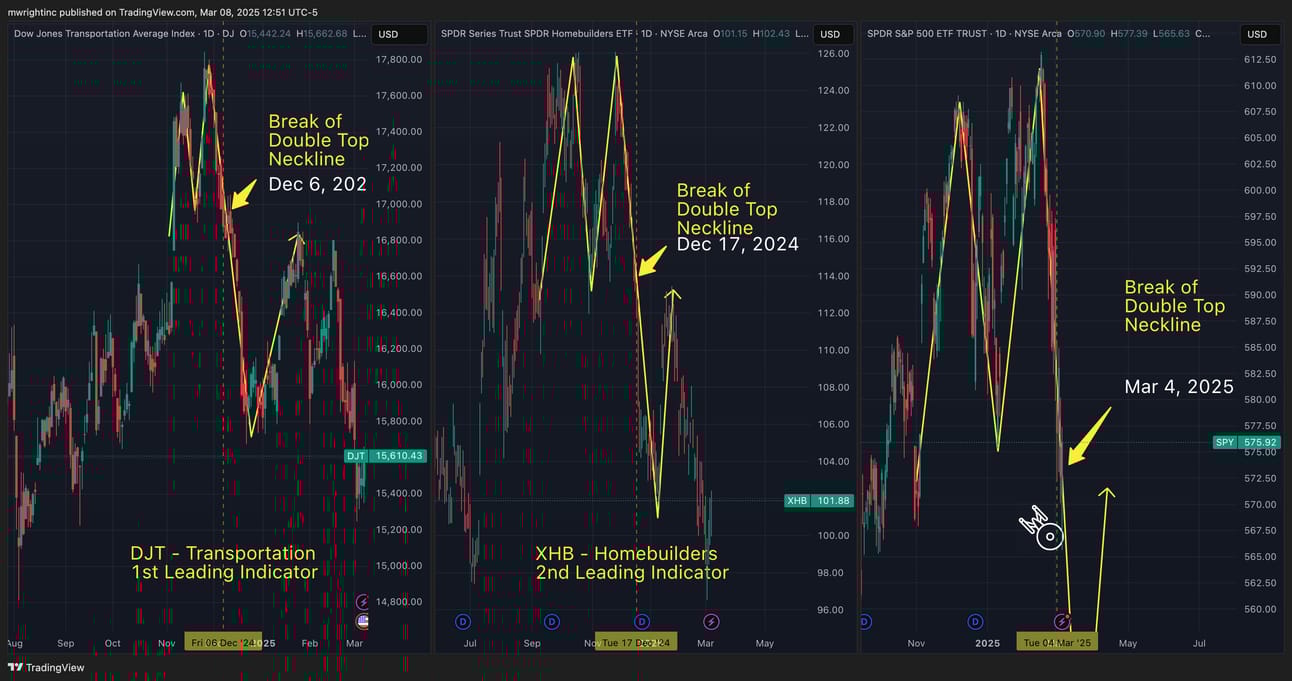
$DJT and $XHB as leading indicators for $SPY
When these are trending up, it is a relatively safe bet that we are in a strong market and we can expect indexes like SPY will continue to rise. However, since November, 2024, $DJT has been in a free-fall. The same has been true for XHB. In December, 2024, both indices broke through the neckline of their “Double-Top” formations, signaling, and following through with sizable moves down (Chart patterns will be topic for a future newsletter).
While this was happening, SPY was approaching the top of a 10 year old channel, and beginning to form it’s double top by mid-February, 2025. Now, we see it has, in the past few days, crossed the neckline of its double-top at about $575. It has also reached its 216 EMA (Exponential Moving Average), its 216 SMA (Simple Moving Average), and is now crossing the halfway point between a 3 year Magic Linear Regression Channel [MW] baseline and the bottom of the channel. To me, this signals that if it breaks through the EMA and SMA (the fact that price has reached those levels means that it has already broken the more commonly used 200s - EMA & SMA) - that a trip to the bottom of the channel is inevitable at about $555.
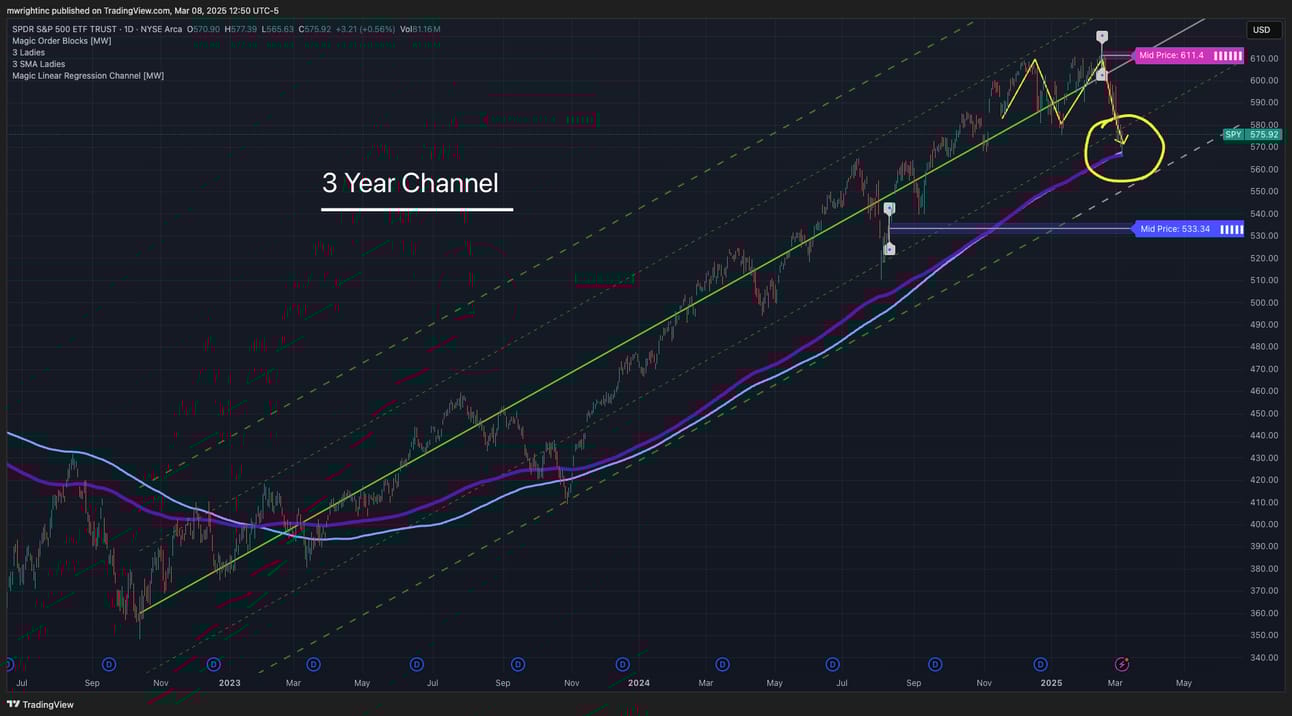
$SPY with 3-Year Magic Linear Regression Channel [MW]
I also have a super-secret indicator, a stochastic volume oscillator, that when used in conjunction with the Magic Candles PRO [MW] indicator, seems to indicate that $SPY buyers have left the building (or are actively leaving) during a downtrend, and following a yellow Magic Candle (which indicates a battle between buyers and sellers has ended). So, I am not at all confident that the moving averages, or the double-top neckline will hold up, which makes $SPXU look like a good short term play.
More Resources
Free TradingView indicators you can use right now in your account. Don’t have a TradingView account. Click this link to get one.
Magic Order Blocks [MW] https://www.tradingview.com/script/mC37KVoz-Magic-Order-Blocks-MW/
QQQ and SPY Price Levels [MW] https://www.tradingview.com/script/uthqQCwb-QQQ-and-SPY-Price-Levels-MW/
Magic Linear Regression Channel [MW] https://www.tradingview.com/script/qm2pmUW4-Magic-Linear-Regression-Channel-MW/
ATR Bands (Keltner Channel), Wick and SRSI Signals [MW] https://www.tradingview.com/script/lH6Yze4x-ATR-Bands-Keltner-Channel-Wick-and-SRSI-Signals-MW/
Bollinger Band Wick and SRSI Signals [MW] https://www.tradingview.com/script/cqTYgepJ-Bollinger-Band-Wick-and-SRSI-Signals-MW/
Price and Volume Stochastic Divergence [MW] https://www.tradingview.com/script/jnsqx9W9-Price-and-Volume-Stochastic-Divergence-MW/
Multi VWAP from Gaps [MW] https://www.tradingview.com/script/EqIgibII-Multi-VWAP-from-Gaps-MW/
Multi VWAP [MW] https://www.tradingview.com/script/L8cxNVC7-Multi-VWAP-MW/
MW Volume Impulse https://www.tradingview.com/script/c8A2cQb7-MW-Volume-Impulse/
The End
If you like this newsletter, let me know, and please share. If you don’t like it, please tell me why, and I’ll do my best to make it better. And remembre, if you have any questions, feel free to reach out to me on Reddit, X.com, TradingView, or Youtube. If for some reason you forget, you can always get those details from the footer at mwright.com