- Trading Advice for Losers
- Posts
- 1 Day Rockets - Part 2
1 Day Rockets - Part 2
They All Fall Down
Mo Wright
March 30, 2025
⭐ Join our subscriber community at mwright.com ⭐
Introduction
Welcome back. In this issue we’ll be doing a deeper dive into a topic that garnered a lot of attention in our Youtube Channel, MWRIGHT TRADING, 1-Day Rockets. Stocks that have potential for large 1-day moves. We’ll also be reviewing $SPY
I am not an expert, and you should not treat any of what is said in this newsletter as financial advice. It’s just my opinion. The opinion of an average trader that has had some success, and many failures.
What makes my opinion different, though, is that I’ve spent the last two years coding trading indicators and strategies full-time to supplement my own trading. And, I’ve been building apps and websites since the browser was invented.
You can access all of the tools that I’ve built at https://mwright.com. Indicators. Calculators. Strategies. Browser extensions. Etc.
$SPXU is a triple-leveraged ETF that does the inverse of the S&P 500 ($SPY), times 3. Over the past few newsletters I’ve discussed the bearish view on $SPY. It hasn’t changed. We’ll go review that continued journey later in the newsletter when we cover $SPY.
$LX, however, seems to be doing what no other stock seems to be able to do, continue its march upward in spite of weakness in the S&P 500. It’s up over 1000% since November, and hasn’t really deviated from that course. However, there is a bearish Magic Order Block [MW] on the 1 Day chart at $13.23, so expect a reaction from there.
They All Fall - 1 Day Rockets - Part 2
A few months ago a Redditor named u/1215DayTrading created a post about their breakout strategy. I created a watchlist - and a YouTube video on how to create the watchlist - using the TradingView screener based on the strategy’s requirements of
Exceptionally high pre-market volume
A strong pre-market move up
Consolidation towards the end of pre-market
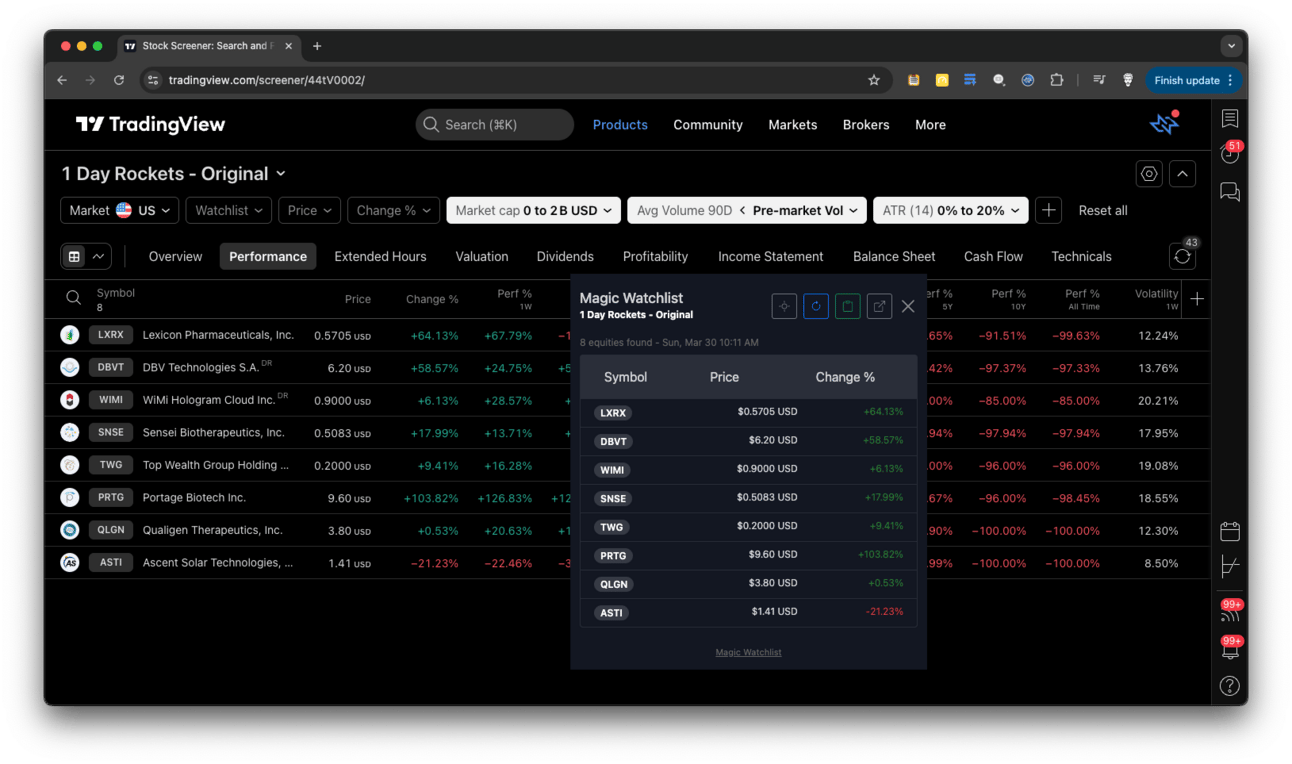
TradingView Screener with Magic Watchlist window for direct links to charts
There were some other criteria needed to place the trade, but what I found was that although the OP (original poster) had pretty good success with their method, capturing the breakout move was a little harder for me to do consistently.
The OP claimed a 71% success rate and a reward:risk ratio of 3:1. Meaning that for every dollar they were willing to risk, it was reasonable to expect to win 3x that amount.
I found that not only was the pattern uncommon, but when it did happen, if you didn’t catch the initial move, or worse, you got in at the end of the initial move, you would have to wait a while for the next surge, if there was one.
That’s when I noticed that almost every one of those trades had a “blow-off top”. Meaning they would go spectacularly high, then fall like a rock for a period of time. What made the pattern even easier to spot was having the Magic Order Blocks [MW] and Multi VWAP [MW] (or VWAP) indicators on my chart, because the candle patterns for each of these types of stocks would show resistance at a bearish order block or at VWAP that would ultimately be the point of collapse.
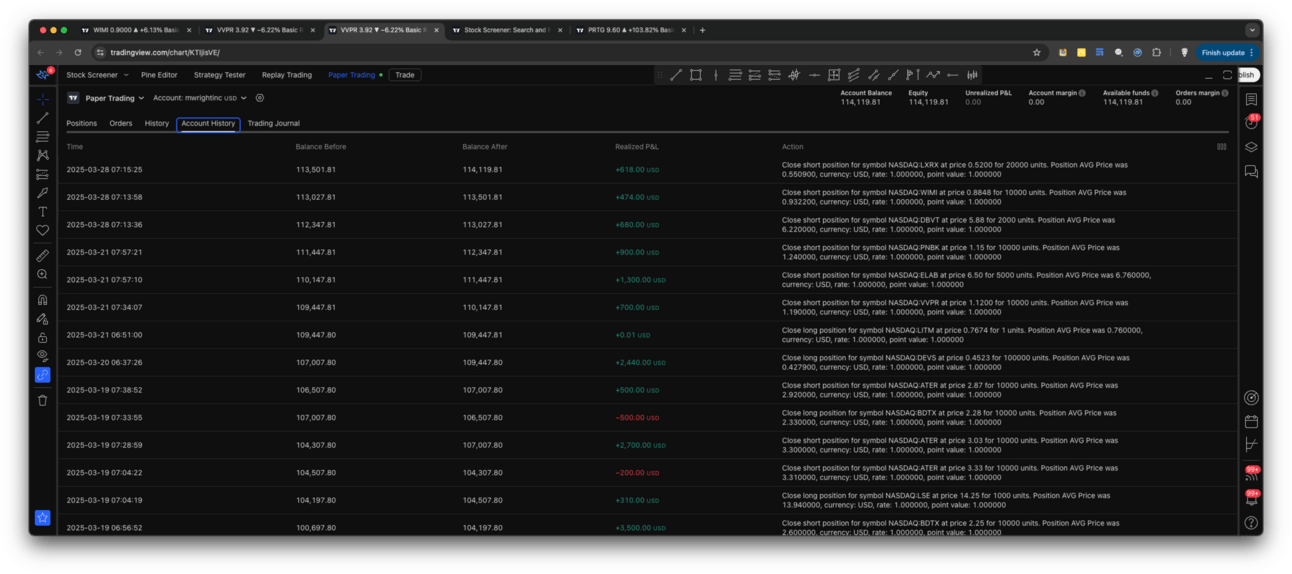
Last 14 trades using 1 Day Rockets short strategy
It happened so frequently that I started opening short positions on the stocks, and my win rate shot up. I would set my exits either at the pre-market consolidation, or if the price had already fallen below that, I would exit at the next significant Fibonacci level based on the pre-market low and the daily high, OR at any previous pivot low.
Below is a table showing the last 14 trades taken on a $100K TradingView paper account.
# | Ticker | Profit/Loss | Time |
|---|---|---|---|
1 | +618.00 | 2025-03-28 07:15:25 | |
2 | +474.00 | 2025-03-28 07:13:58 | |
3 | +680.00 | 2025-03-28 07:13:36 | |
4 | +900.00 | 2025-03-21 07:57:21 | |
5 | +1,300.00 | 2025-03-21 07:57:10 | |
6 | +700.00 | 2025-03-21 07:34:07 | |
7 | +0.01 | 2025-03-21 06:51:00 | |
8 | +2,440.00 | 2025-03-20 06:37:26 | |
9 | +500.00 | 2025-03-19 07:38:52 | |
10 | −500.00 | 2025-03-19 07:33:55 | |
11 | +2,700.00 | 2025-03-19 07:28:59 | |
12 | −200.00 | 2025-03-19 07:04:22 | |
13 | +310.00 | 2025-03-19 07:04:19 | |
14 | +3,500.00 | 2025-03-19 06:56:52 | |
Total | +13,922.01 |
One other indicator I watched was my personal Magic Volume Oscillator PRO [MW] indicator. It can suggest when buyers are exiting. In the case of these stocks with abnormal volume, when the Magic Volume Oscillator [MW] is decreasing strongly from over 80, after price begins its first bearish Magic Order Block [MW] rejection, this is the signal to enter short. It implies that the buying volume that sent the price skyrocketing is now falling.
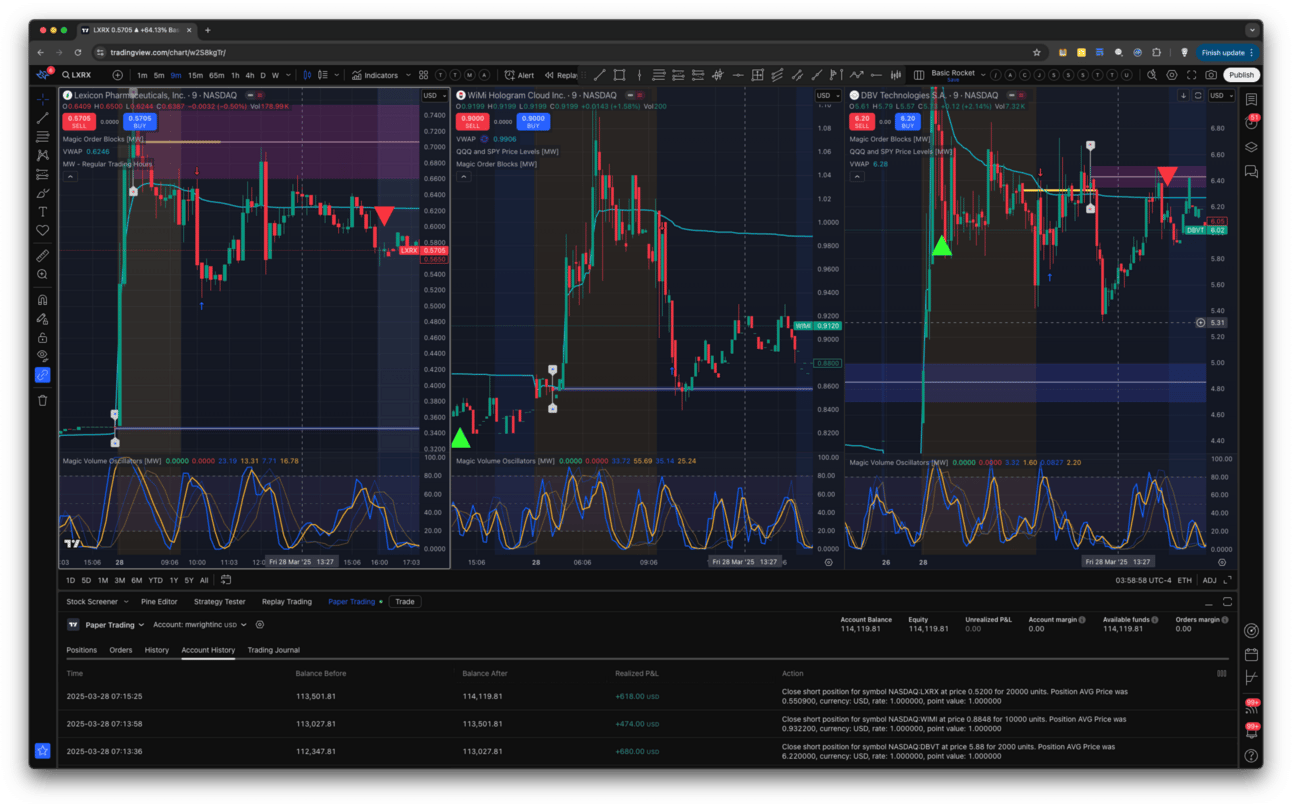
$LXRX, $WIMI, $DBVT Charts. Traded short near VWAP or at the yellow line which represents the Bearish Magic Order Block [MW] at the time of the trade.
On the flip side, if price action goes up and the Magic Volume Oscillator PRO [MW] goes down, then bears have capitulated, and the bulls have won. For a short position, that means “Get out immediately!”
Although entries following a breakdown below consolidation can work, getting in at a price that’s close to an order block or VWAP level provides a much healthier R:R ratio.
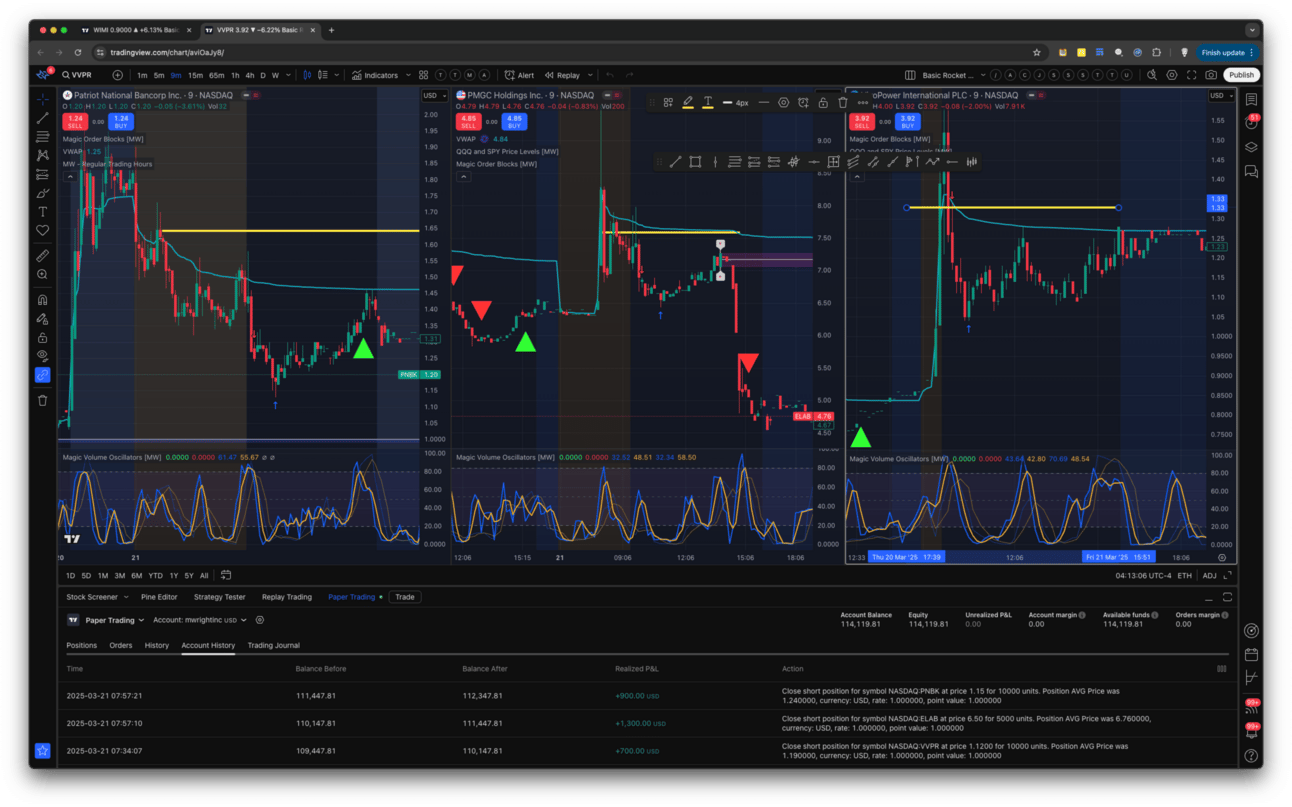
$PNBK, $ELAB, $VVPR Charts. Traded short near VWAP or at the yellow line which represents the Bearish Magic Order Block [MW] at the time of the trade.
What’s important to remember is that they all seem to fall significantly from an order block or VWAP at least one time during the morning trading hours. However, there are a few occasions where the equity isn’t just going through a pump-and-dump - a legitimate fundamental upswing is underway. So, after you catch a down movement, take your profits and get out.
There is a limit to how much money you can lose in a long position, but losses in a short position are unlimited. You can lose much more than your initial investment if you hold onto a bad trade. For example, if you go long on a stock and the value of your position is $1000, the most you could lose is $1000 when the price goes to zero. If you’re in a short position, if the price doubles, you lose $1000. If the price triples, you lose $2000. If the price quadruples, you lose $3000. And so on.
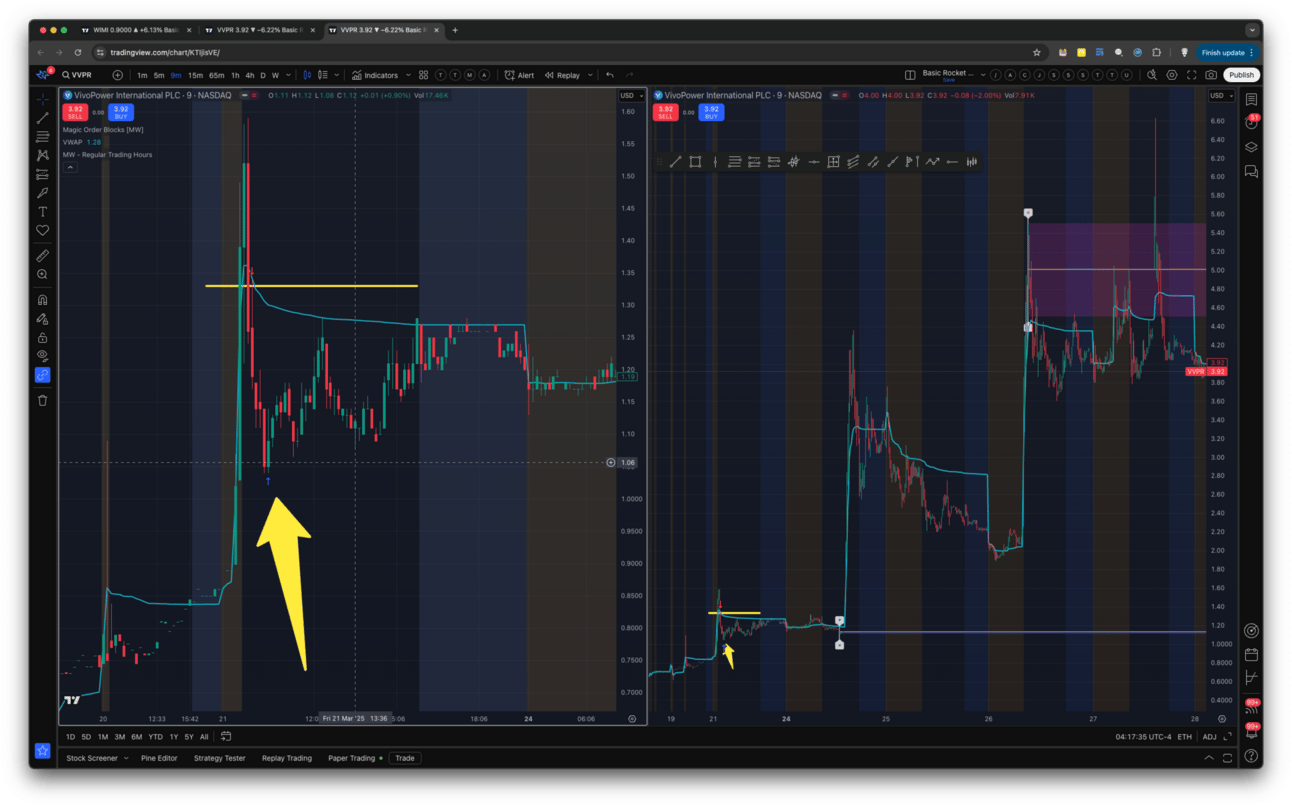
A good short trade on $VVPR on 3/25/2025 would have been a devastating loss if held for even 1 more day.
Unlike with the OPs setup, these bearish drops happen almost every day across multiple stocks, so they’re easier to find. And, sometimes, they tend to have similar timing, or reflect the behavior of the greater market, which means that watching them side-by-side, or in conjunction with $SPY, can be helpful.
$SPY Analysis
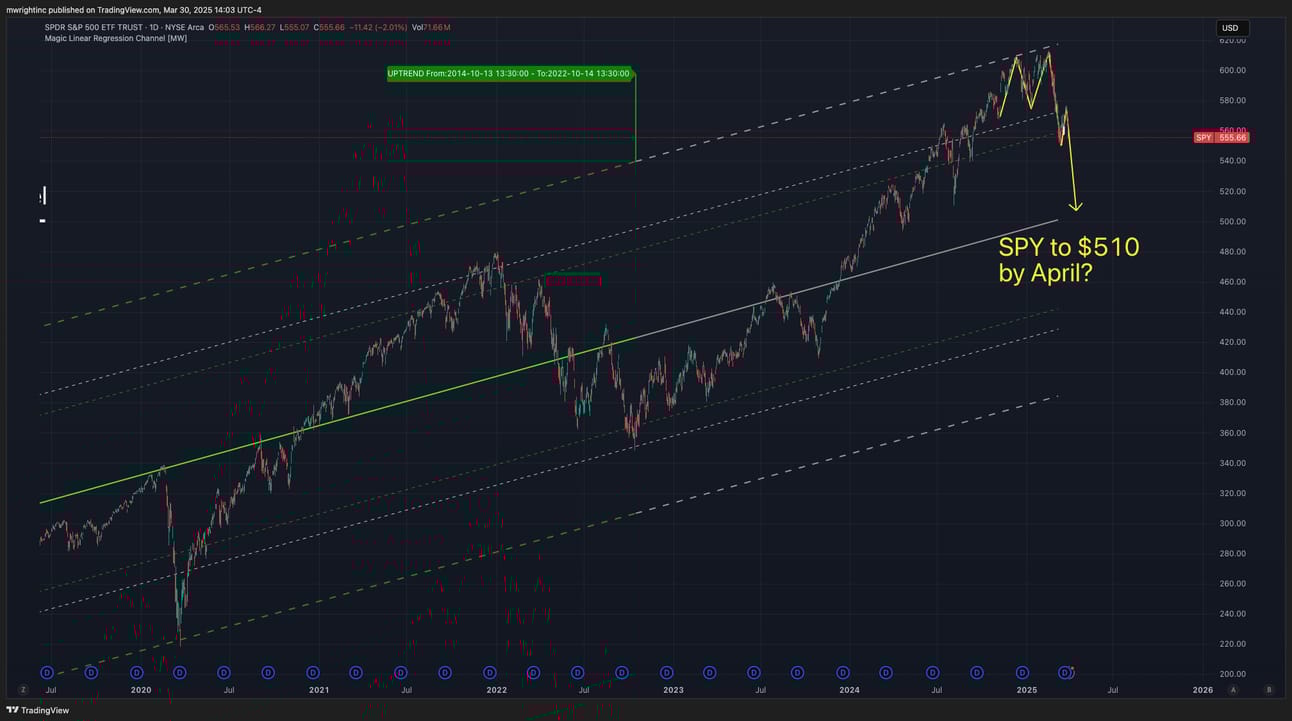
$SPY 10-Year Channel
Here is an updated chart I included in last week’s newsletter showing $SPY rejecting the top of a 10-year channel. The speculation was that it could hit the baseline (or midline) of the channel by April. Although it seems unlikely for that to happen by the beginning of April, $510 in the month of April is starting to look very realistic.
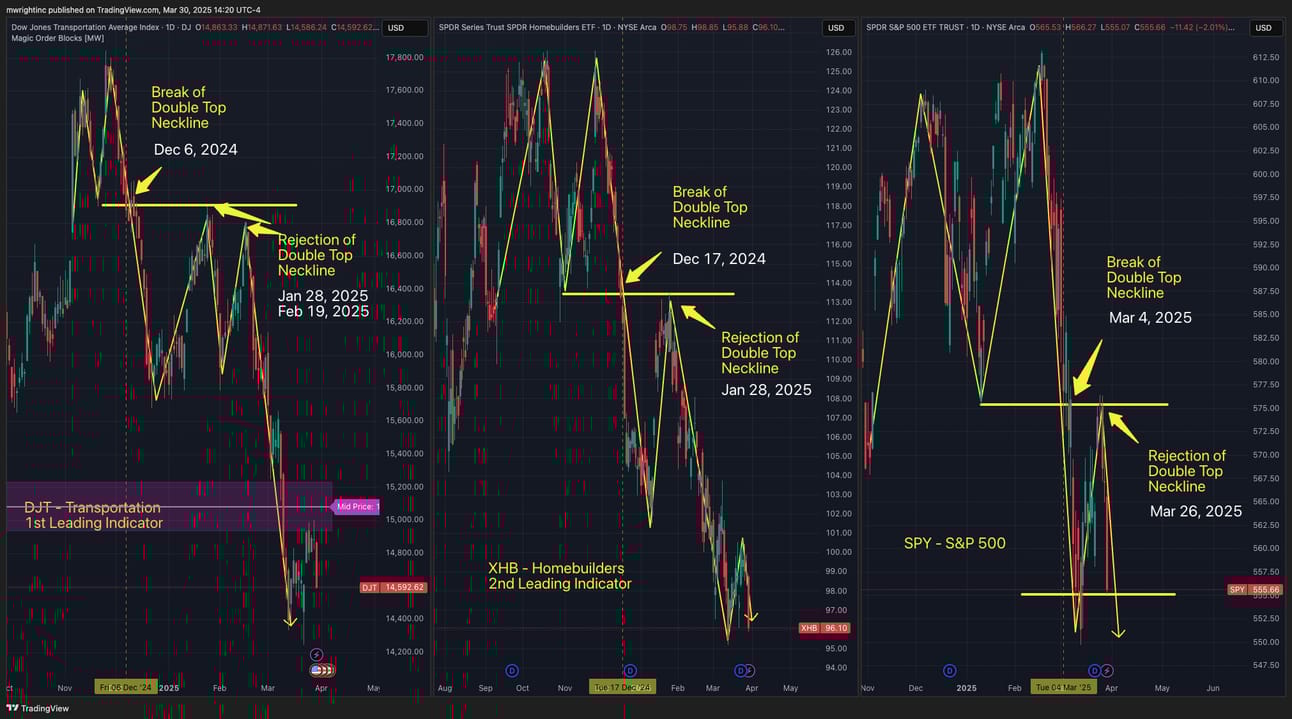
$DJT and $XHB, acting as lead indicators for $SPY, still look bearish
As before, our thesis is that if there is weakness in the transportation and homebuilding sectors, there really isn’t much hope for a strong $SPY recovery. Transportation represents corporations forecasting for the delivery of future orders, and homebuilding represents the ability and interest of buying homes from consumers. If businesses and the general public are both tightening their belts, there isn’t a good reason to believe that the S&P 500 will resume its rally. And, both the $DJT (Dow Transportation) and $XHB (S&P 500 Homebuilders) are showing continuing weakness.
I’m looking at $SPY to hit $540 in the next week or so, and maybe $510 by the end of April.
More Resources
Free TradingView indicators you can use right now in your account. Don’t have a TradingView account. Click this link to get one.
Magic Order Blocks [MW] https://www.tradingview.com/script/mC37KVoz-Magic-Order-Blocks-MW/
QQQ and SPY Price Levels [MW] https://www.tradingview.com/script/uthqQCwb-QQQ-and-SPY-Price-Levels-MW/
Magic Linear Regression Channel [MW] https://www.tradingview.com/script/qm2pmUW4-Magic-Linear-Regression-Channel-MW/
ATR Bands (Keltner Channel), Wick and SRSI Signals [MW] https://www.tradingview.com/script/lH6Yze4x-ATR-Bands-Keltner-Channel-Wick-and-SRSI-Signals-MW/
Bollinger Band Wick and SRSI Signals [MW] https://www.tradingview.com/script/cqTYgepJ-Bollinger-Band-Wick-and-SRSI-Signals-MW/
Price and Volume Stochastic Divergence [MW] https://www.tradingview.com/script/jnsqx9W9-Price-and-Volume-Stochastic-Divergence-MW/
Multi VWAP from Gaps [MW] https://www.tradingview.com/script/EqIgibII-Multi-VWAP-from-Gaps-MW/
Multi VWAP [MW] https://www.tradingview.com/script/L8cxNVC7-Multi-VWAP-MW/
MW Volume Impulse https://www.tradingview.com/script/c8A2cQb7-MW-Volume-Impulse/
The End
If you like this newsletter, let me know, and please share. If you don’t like it, please tell me why, and I’ll do my best to make it better. And remembre, if you have any questions, feel free to reach out to me on Reddit, X.com, TradingView, or Youtube. If for some reason you forget, you can always get those details from the footer at mwright.com