- Trading Advice for Losers
- Posts
- The Magic of Stochastic Volume
The Magic of Stochastic Volume
Introducing the Stochastic Volume Oscillator PRO [MW] TradingView Indicator
Mo Wright
May 18, 2025
⭐ Join our subscriber community at mwright.com ⭐
Introduction
Welcome back. In this issue I’ll go over the Stochastic Volume Oscillator PRO [MW] Futures Strategy tool for TradingView. It generates a profit factor of 5 (winnings make up 5x the value of losses), which makes it one of the top strategies that I’ve been able to come up with. We’ll also review the stock of the week, $ADSK, as well as review $SPY.
I am not an expert, and you should not treat any of what is said in this newsletter as financial advice. It’s just my opinion. The opinion of an average trader that has had some success, and many failures.
What makes my opinion different, though, is that I’ve spent the last two years coding trading indicators and strategies full-time to supplement my own trading. And, I’ve been building apps and websites since the browser was invented.
You can access all of the tools that I’ve built at https://mwright.com. Indicators. Calculators. Strategies. Browser extensions. Etc.
Stock of the Week: $ADSK
I’ve been following Autodesk for 30 years. They build the software the engineers use to build the physical world. Cars. Buildings. Doorknobs. You name it. Whether its 2D CAD software, 3D dimensioning, finite element analysis, 3D printing, they have it covered. On top of that, as industries have shifted - including their own - so have they. They’ve been pioneering generative design since before the term AI became popular. Generative design is using AI to model, then manufacture objects. Usually using novel 3D printing material like powdered metals. Fundamentally, they’ve been a great company. The type that Chris Mayer talks about in his book, “100 Baggers: Stocks that return 100-to-1 and How To Find Them”.

Image Credit: Autodesk
But, what about the technicals.
Using the Magic Linear Regression Channel [MW] we can create channels on a weekly timeframe that show similar baselines starting from both 2009, following the Great Financial Crisis and starting from its last dip below $50/share in 2016. In both cases the baseline has been respected as resistance in multiple occasions. In the 2009 channel, the baseline has already been broken, and in the 2016 channel, price is approaching the baseline.
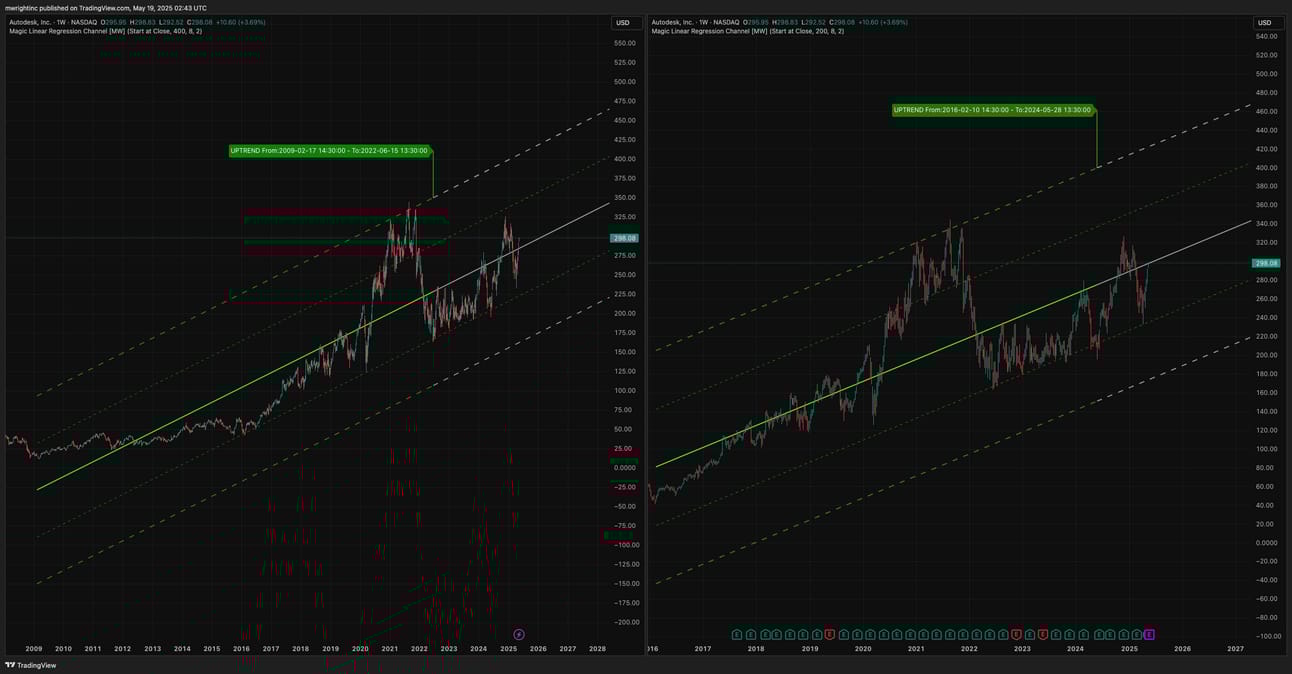
We could potentially see a drop from the 2016 channel, but because we are also seeing higher highs and higher lows in an environment that is heavily skewing towards AI stocks like $PLTR, and considering that the name $ADSK hasn’t really come up as an AI play means that there is a lot more room for it to move up. As a fair disclosure, I do have a long-term position in $ADSK.
The Magic of Stochastic Volume
Many believe that directional volume is what dictates price. Except, when it doesn’t. After years of searching for a reliable way to judge the impact that volume has on price, I realized that I hadn’t yet looked at stochastic volume.
A stochastic calculation turns a noisy cycle of a given measurement into discrete highs and lows that go from 0 to 100. It makes the cycles easier to see. With volume, it means that even in times of peak volume, there are periods where, although volume might be relatively high, it may still take a break compared to earlier in the period, generating a decreasing, low, or near zero value in stochastic volume (sVolume).
Depending on what’s happening in the market, this stochastic decrease, could mean that a significant level of support or resistance has been reached, and participants are taking their profits and leaving. In which case, it could lead to a sharp price reversal, or at times, price acceleration, depending on whether buyers or sellers have abandoned their defense.
If the price doesn’t reverse significantly, though, consolidation is likely occurring, and it could mean that on the next wave up in sVolume, the price could break through support or resistance.
The real trick is assigning a reason to the decrease in stochastic volume. Why is participation going down, relatively? It could simply be lunchtime, which does tend to lead to lower volume. A consistently low stochastic volume almost always indicates consolidation, or low price movement.
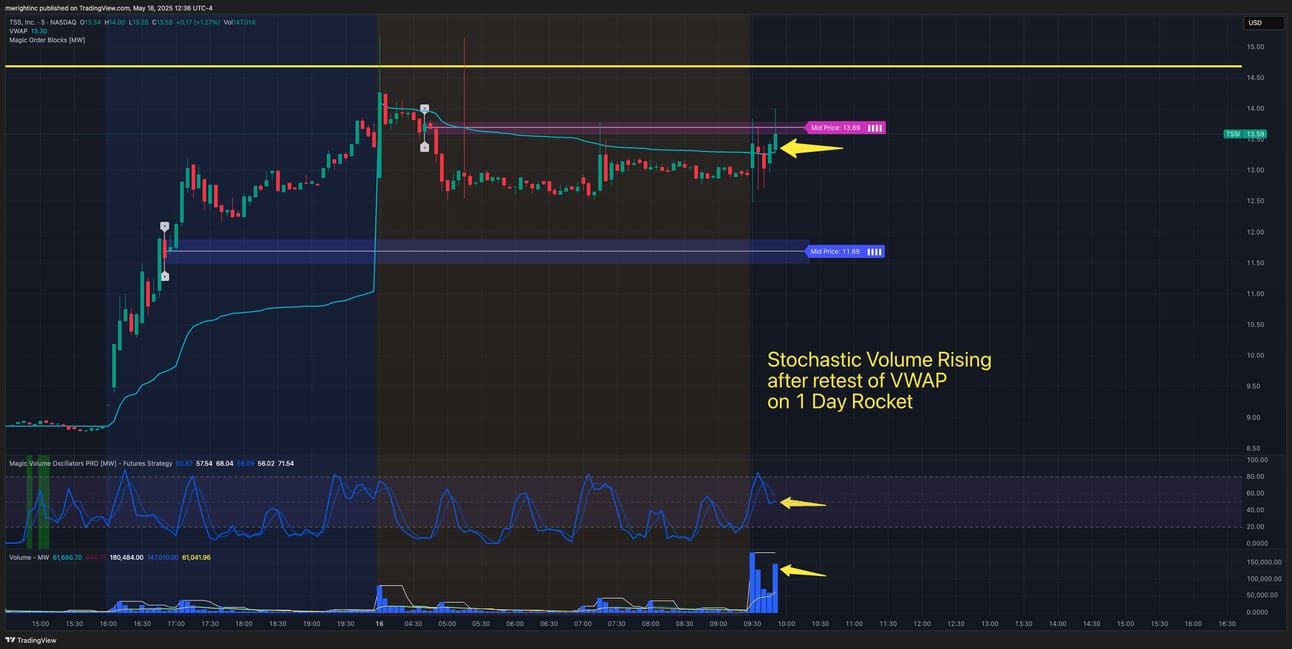
Stochastic Volume rising after retest of VWAP on 1 Day Rocket $TSSI
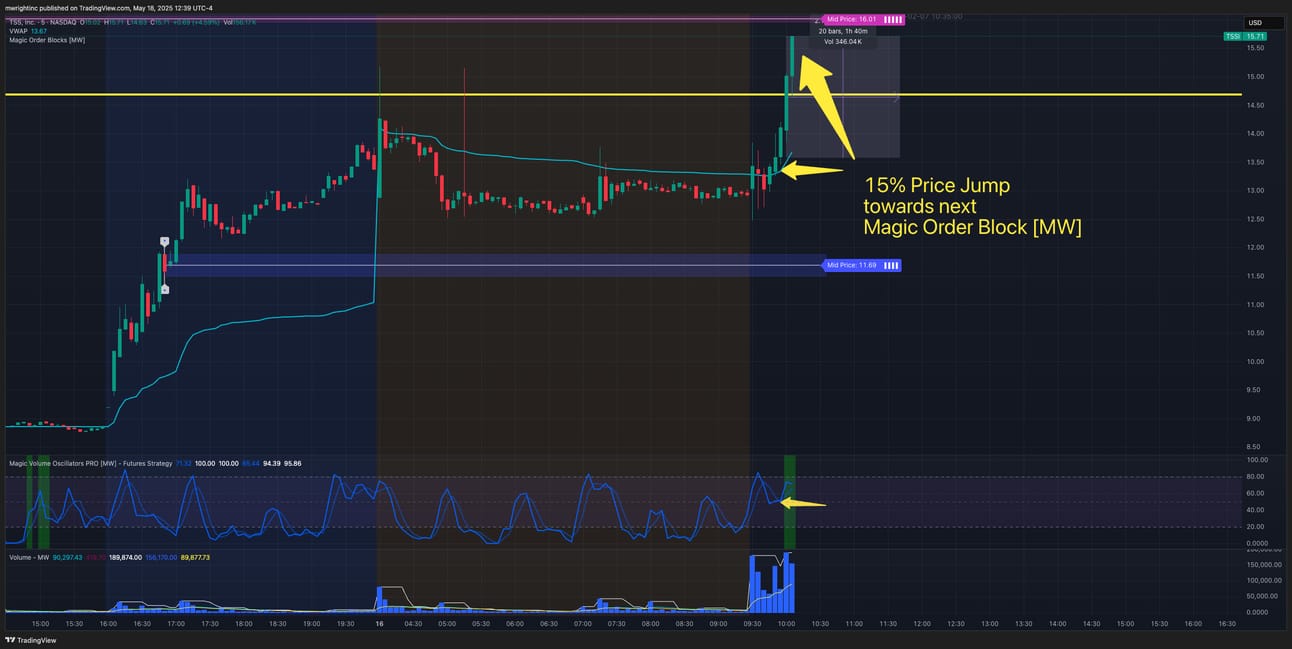
15% Price jump towards next order block on 1 Day Rocket $TSSI
I was able to see these patterns first-hand when trading stocks that have extremely high pre-market volume and are gapping up (opening at a much higher price than the previous day’s closing price). I refer to them as “1 Day Rockets”. For more on this, check out u/1215DayTrading’s post from 4 months ago. https://www.reddit.com/r/Daytrading/comments/1hvwxps/comment/m633s64/?context=3
Early in the trading day, with these types of equities, if stochastic volume bottoms out and begins to increase, there will likely be a corresponding increase in price that could amount to a 5%, 10%, or 20% or greater move. With higher volume comes higher volatility, though, so there is also a chance of seeing an equally large move to the downside. So, it’s important to enter long in an area of pre-market support, or at the daily VWAP.
These types of stocks also seem very sensitive to key resistance levels. For that, I usually use the Magic Order Blocks [MW] indicator on TradingView to identify them. When resistance is hit, and stochastic volume begins to fall from 100, it seems to be a reliable sign that the astronomical upward movements are about to come to an end, and reverse hard (at least momentarily, if not for the rest of the day). This can serve as either an exit signal for long positions, or an entry signal for short positions.
With all of this in mind, I started playing with a combination of stochastic values. Stochastic volume. Stochastic RSI (Relative Strength Index). Stochastic MACD (Moving Average Convergence and Divergence). Stochastic VWAP (Volume Weighted Average Price). Each one representing a discrete cycle in some commonly used metrics. Stochastic RSI shows cycles in price. Stochastic MACD shows the cycles between the difference between moving averages. Stochastic VWAP shows cycles in the trend of the volume weighted average price over a trading day.

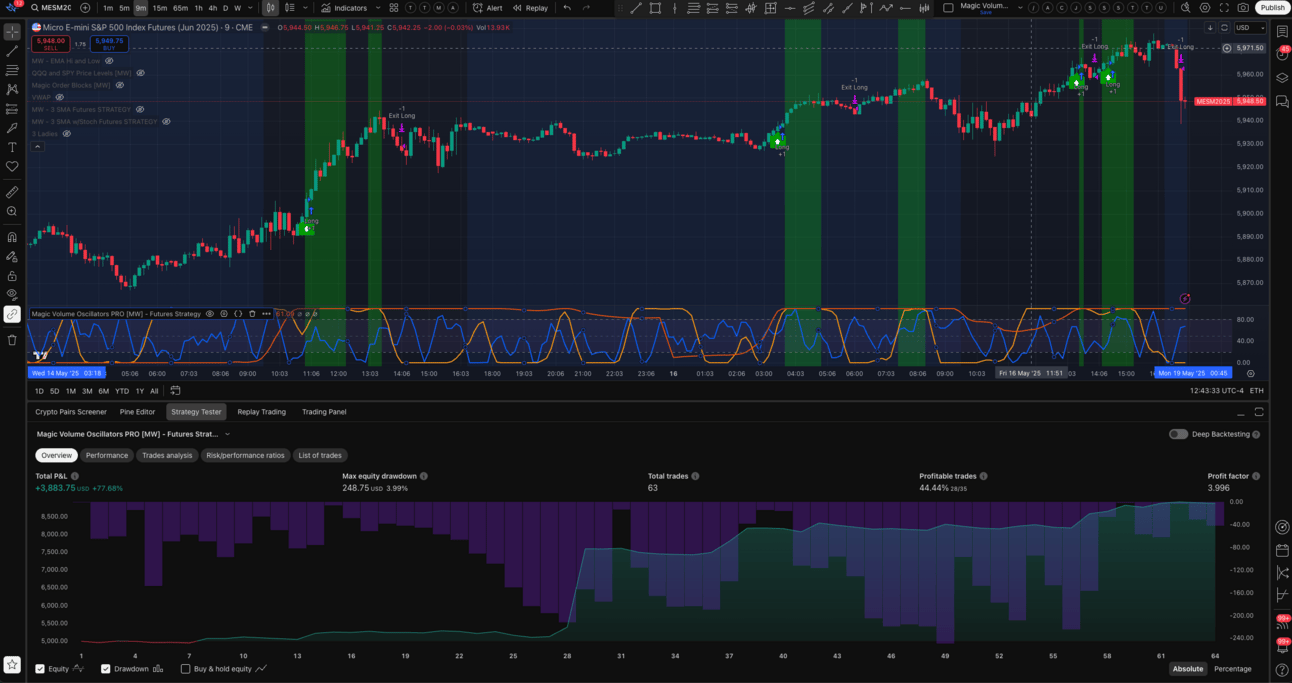
/MESM2025 Results with Long and Short Positions
/MESM2025 Results with Long Positions Only
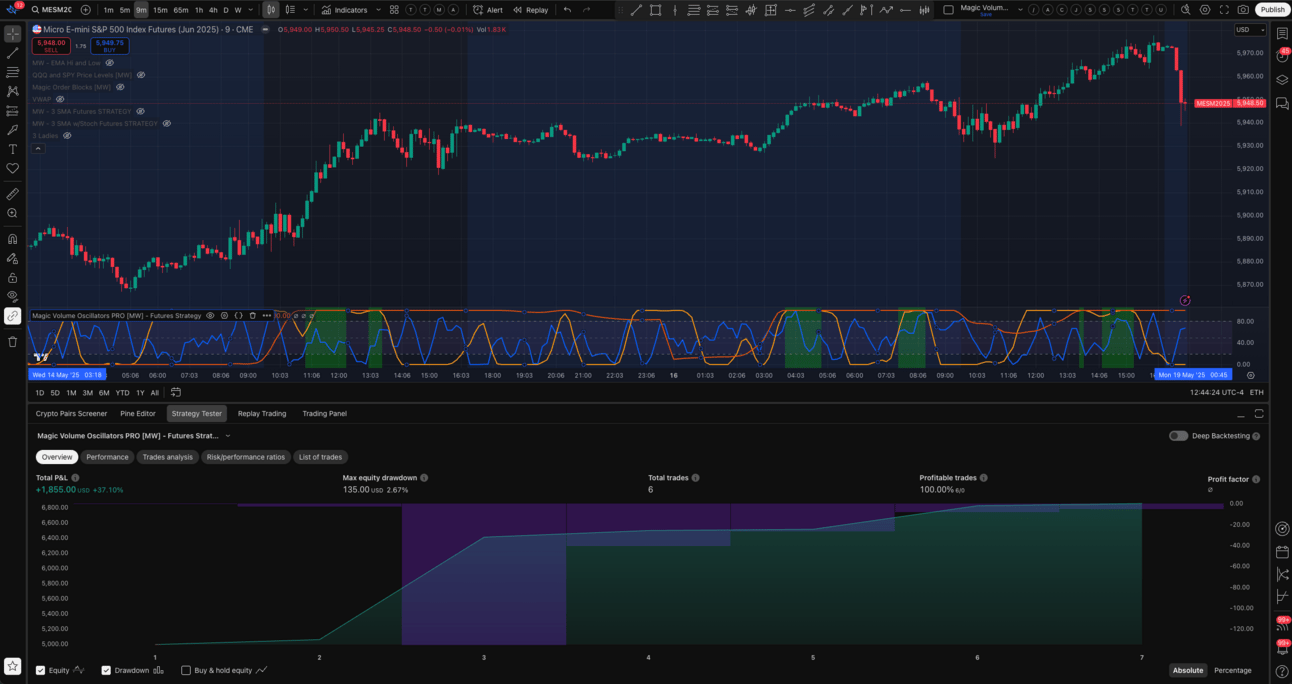
/MESM2025 Results with Short Positions Only
I couldn’t find a successful relationship when looking at $SPY, but I found great measurable correlations when looking at the S&P 500 Mini Futures (/MES). The success could be seen in the form of strategies with profit factors greater than 5 for both long and short positions on a 9 minute timeframe. I suspect that the difference between $SPY and /MESM2025 is a result of the moving averages and volume weighted moving averages being more representative of what’s actually happening throughout the trading period since there isn’t a daily 6 hour break between active sessions.
I asked ChatGPT about using stochastic volume, and it showed many of the same conclusions, with one big difference: bearish diversion. This is when price goes up, but stochastic volume doesn’t confirm the move by going up. As I said earlier, my interpretation has been that once you go from bulls and bears, to either bulls or bears, stochastic volume will decrease, and whoever is left will win big time.
In summary, because it works great with /MES, I built a strategy with signals and alerts specifically for /MES called Magic Volume Oscillators PRO [MW] - Futures Strategy. Although the name is very specific, the signals, as well as individual stochastic charts can be turned off to provide a more generic tool that can show sVolume, sRSI, sMACD, and sVWAP individually. It is also important to note that the closer you get to daily timeframes, the less meaning there is for measurements like intraday volume and VWAP.
I’ve also moved over from paper-trading 1 Day Rockets, to live trading them. Paper trading the downward moves was pretty easy, but in live trading, there is much larger margin requirement when compared to long positions. So, I had to learn how to trade the upward moves, and watching stochastic volume patterns has helped a lot with that.
For your reference, here are the settings that I use for /MESM2025 on the 9 minute and 5 minute timeframe. All settings assume extended hours are being used:
9 minute
LONG: sVolume:5, sMACD:9, sVWAP:39
SHORT: sVolume:13, sMACD:8, sVWAP:22
5 minute
LONG: sVolume:20, sMACD:24, sVWAP:3
SHORT: sVolume:21, sMACD:2, sVWAP:12
$SPY Analysis
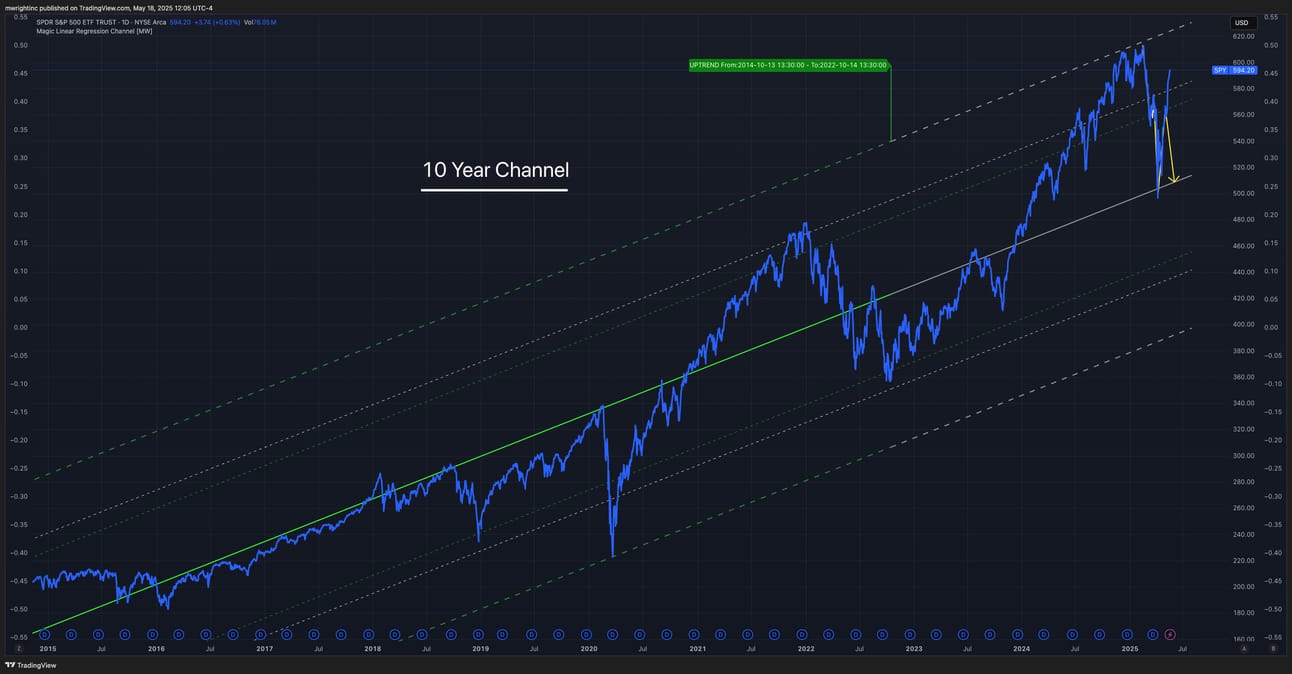
$SPY 10 Year Channel
It looks like the bounce from the baseline of the 10 Year Channel was legit. This was even more of a “V-shaped” recovery than when covid hit. We are approaching the $SPY 600 level, though, (/MES $6000), so don’t be surprised to see at least a little bit of consolidation at that price. Also, we have the top of the channel fast approaching at $625. Breaking out of the 10-year channel could be very bullish. Should that happen, expect at least a retrace to the top of the channel.
On the downside, it’s not uncommon for a ferocious move up to be followed by some type of downward movement so that other market participants who were caught flat-footed can get back into the game at around $570. $570 is also where the 21 weekly moving average and the 200 moving average was recaptured. So, maybe some small positions to ride up to $625 might be worthwhile, but a drop back down to $570 would give me a more confident entry.
100 Baggers for Monday, 5/18/2025
TSSI, ABCCF, LFMD, WLDN, PNTG, TPB, LINC, VZLA, AORT, FGOVF, CWCO, FLGT, GAIN, EIG, STEW, CTLP, ATEN, CSGS, CASH, LSEA, BBSI, NGVT, DGII, SII, PFBC, LEU, AVXL, SLI, NVEE, OSBC, MAG, KRKNF, GLDD, SKE, PPTA, ACMR (This entire list can be copied into TradingView’s Watchlist search field to build a watchlist out of all of the tickers at once).
This list was generated using the Magic Watchlist V2 Google Chrome Extension.
More Resources
Free TradingView indicators you can use right now in your account. Don’t have a TradingView account. Click this link to get one.
Magic Order Blocks [MW] https://www.tradingview.com/script/mC37KVoz-Magic-Order-Blocks-MW/
QQQ and SPY Price Levels [MW] https://www.tradingview.com/script/uthqQCwb-QQQ-and-SPY-Price-Levels-MW/
Magic Linear Regression Channel [MW] https://www.tradingview.com/script/qm2pmUW4-Magic-Linear-Regression-Channel-MW/
ATR Bands (Keltner Channel), Wick and SRSI Signals [MW] https://www.tradingview.com/script/lH6Yze4x-ATR-Bands-Keltner-Channel-Wick-and-SRSI-Signals-MW/
Bollinger Band Wick and SRSI Signals [MW] https://www.tradingview.com/script/cqTYgepJ-Bollinger-Band-Wick-and-SRSI-Signals-MW/
Price and Volume Stochastic Divergence [MW] https://www.tradingview.com/script/jnsqx9W9-Price-and-Volume-Stochastic-Divergence-MW/
Multi VWAP from Gaps [MW] https://www.tradingview.com/script/EqIgibII-Multi-VWAP-from-Gaps-MW/
Multi VWAP [MW] https://www.tradingview.com/script/L8cxNVC7-Multi-VWAP-MW/
MW Volume Impulse https://www.tradingview.com/script/c8A2cQb7-MW-Volume-Impulse/
The End
If you like this newsletter, let me know, and please share. If you don’t like it, please tell me why, and I’ll do my best to make it better. And remembre, if you have any questions, feel free to reach out to me on Reddit, X.com, TradingView, or Youtube. If for some reason you forget, you can always get those details from the footer at mwright.com