- Trading Advice for Losers
- Posts
- The Beauty of Fibonacci
The Beauty of Fibonacci
My theory on why Fibonacci levels are important
Mo Wright
May 04, 2025
⭐ Join our subscriber community at mwright.com ⭐
Introduction
Welcome back. In this issue we discuss one of the most enigmatic, but regularly used, technical analysis tools, Fibonacci levels. We’ll also do a technical analysis on where $SPY is now.
I am not an expert, and you should not treat any of what is said in this newsletter as financial advice. It’s just my opinion. The opinion of an average trader that has had some success, and many failures.
What makes my opinion different, though, is that I’ve spent the last two years coding trading indicators and strategies full-time to supplement my own trading. And, I’ve been building apps and websites since the browser was invented.
You can access all of the tools that I’ve built at https://mwright.com. Indicators. Calculators. Strategies. Browser extensions. Etc.
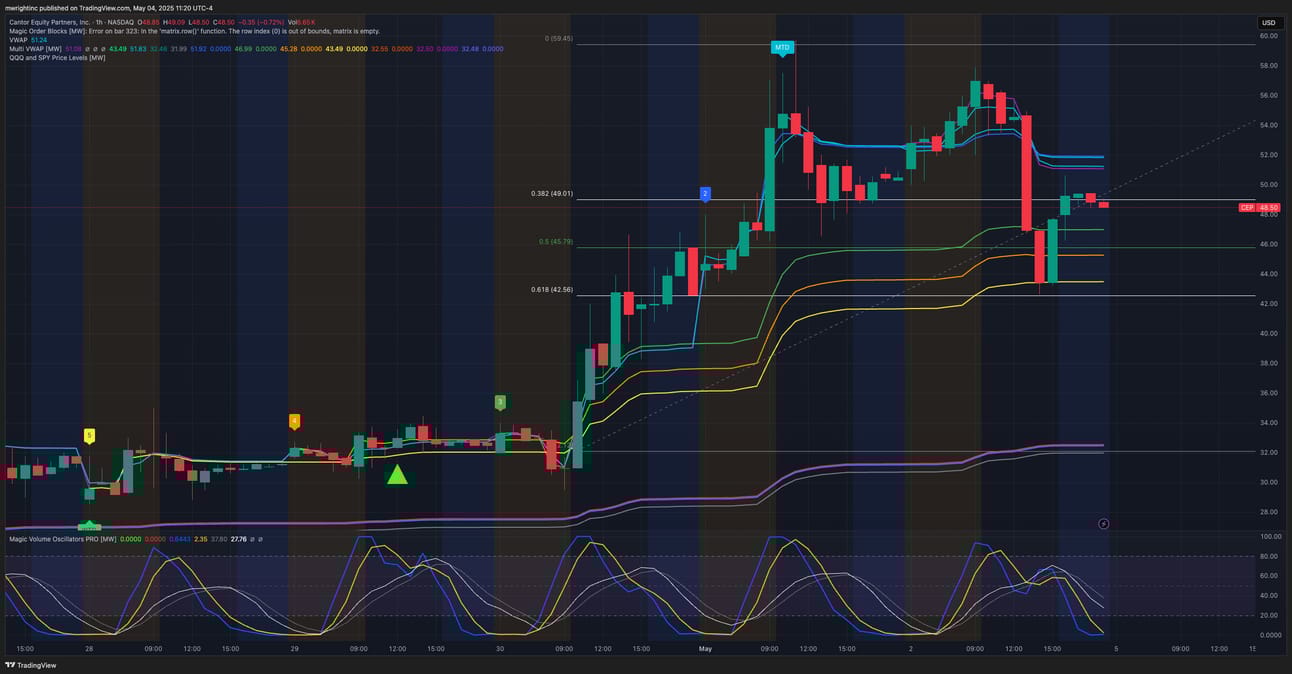
$CEP was a 1 Day Rocket that just kept moving up. After a massive 487.75% move from April 22, 2025 to May 2, 2025, it finally completed a nice Fibonacci retrace, which coincided with a bounce off of its 5 Day AVWAP (shown using the Multi VWAP [MW] indicator) before beginning a new bounce. There is no overhead resistance other than the May 2, 2025 high, so, depending on the general market, this still could have some room to move.
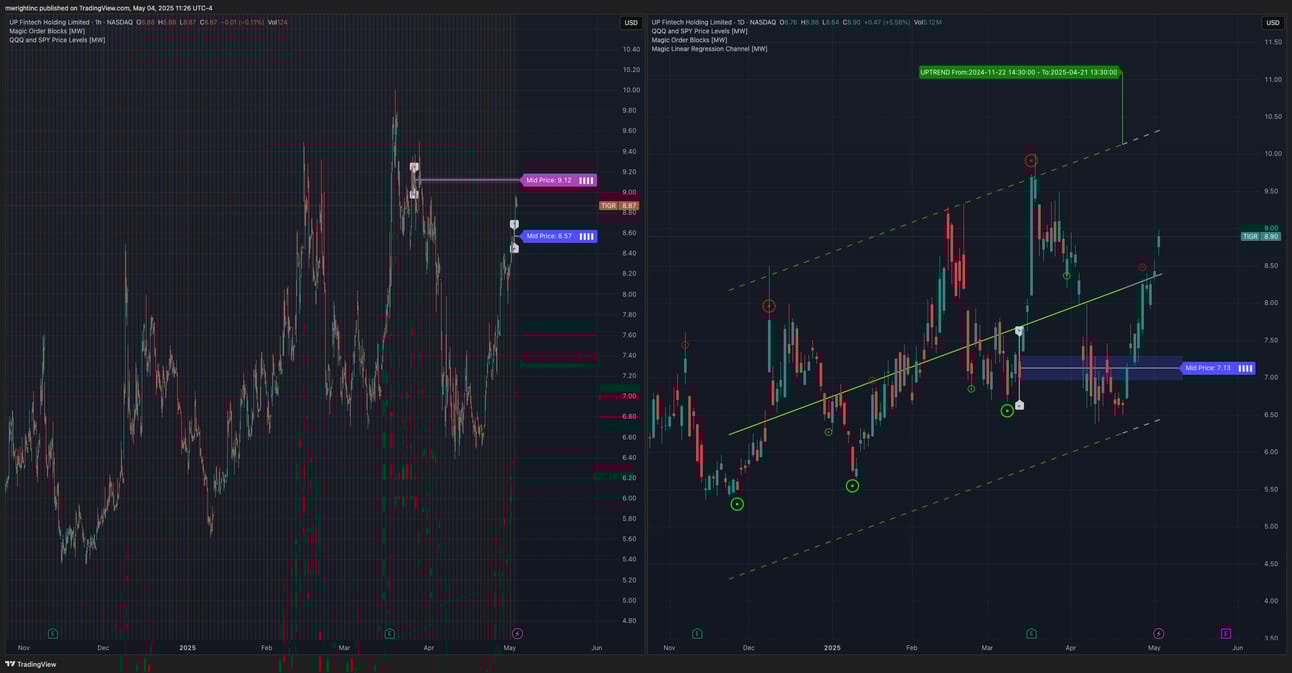
$TIGR is a Chinese based fintech company that I’ve been following for a few years. It has it’s ups and downs. What has made it stick out now is that it seems to have been largely unaffected by the tariffs imposed on China by the U.S. It is about to reach an bearish Magic Order Blocks [MW] on the 1 hour chart, but has recently broke back above the baseline of a 6 month Magic Linear Regression Channel [MW]. If it can break through and hold that order block, look for additional upward movement.
The Beauty of Fibonacci - The Golden Ratio - Phi (Φ) - 1.618
It has been said that the greatest artists used the Golden Ratio (Φ) in the development of their masterpieces. Whether Michelangelo or Da Vinci, or even with the Great Pyramids of Giza, that ratio is present, and can elicit a physical reaction when seen. Here’s why. I believe that the Golden Ratio (Φ) represents the point of awareness for a collective consciousness. When the body of a plant or animal is created, its extremities can be broken down into parts whose physical dimensions, when optimally created, have a Φ ratio. For example, your finger tips, hand, forearm, and entire arm have this ratio. The spirals in a sunflower or pineapple, as well as the pattern in the unwinding of the petals of a flower show this ratio. Leonardo Da Vinci’s Vitruvian Man drawing has it.

I believe that when we see this proportion, we not only inherently “know” that a “cycle” has been completed successfully, we feel it tangibly. This is how we can easily distinguish and recognize a beautiful face, body, animal, sculpture, artwork, or anything from something less aesthetically pleasing. When we experience Φ, our body actually has a physical electro-chemical (or some other type of) reaction. On a collective level, conscious entities, like water, plants, animals, and us can also react collectively. For me, this is why Fibonacci levels on trading charts are important. We implicitly recognize when a pattern has completed, and actual have a physical reaction to it. At which point, a fibonacci set of the conscious actors (61.8%) will recognize the change and react.
Side note: Water is a requirement for conscious life as we know it. According to the research of Dr. Masaru Emoto, water recognizes our conscious thoughts. So, if our existence requires an element that can recognize our consciousness, it is likely to be conscious itself. Life as we know it requires both water and DNA. DNA is like a map, and water, having passed through eons of time on the planet, acts as the navigator of the map while a new life is being constructed.
There are other very unique attributes that makes Φ special. Φ² = Φ + 1 and 1/Φ = Φ - 1. What this means is that if you add the number 1 to Φ (1.618) you get its square (2.618), and if you subtract the number 1 from Φ you get its reciprocal (0.618). This is important to note because the ratio between 1 and 1/Φ and the ratio between 1/Φ and 1-1/Φ (0.382) are both Φ. Simply put, whenever you break down a number by dividing it by Φ, the remaining parts also have a ratio of Φ, and the larger part will have a relationship of 1/Φ with whatever the whole amount is.

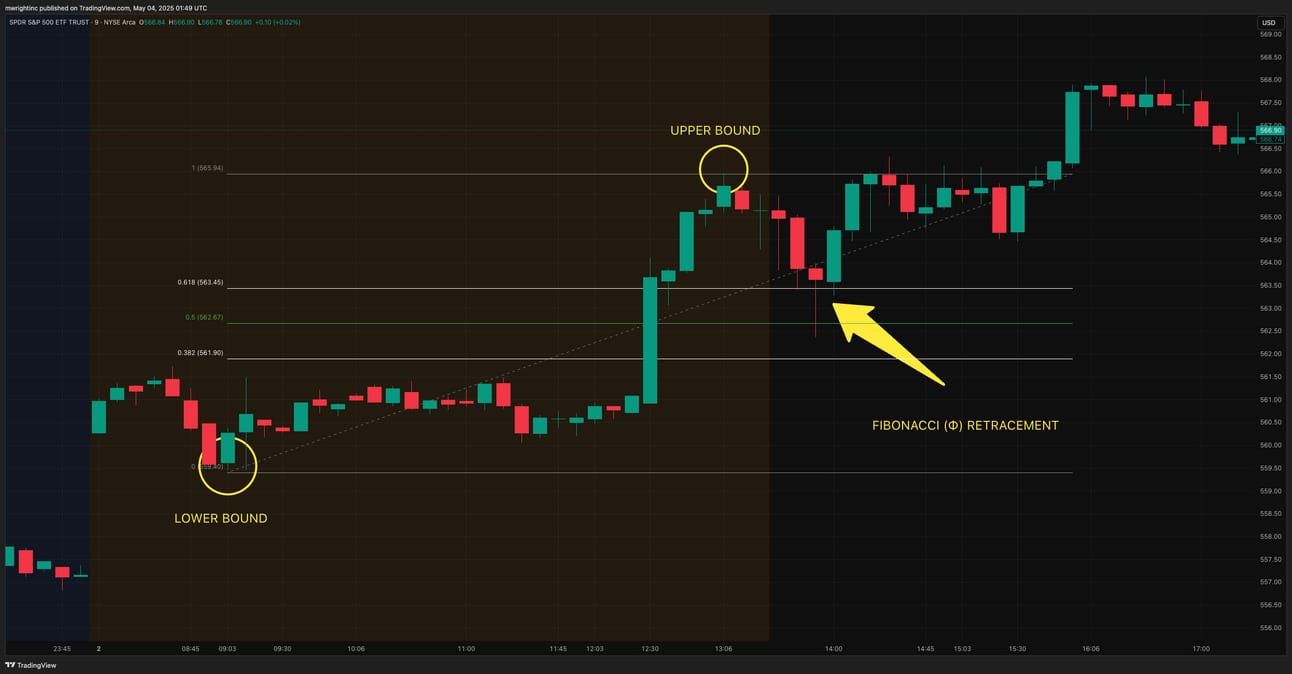
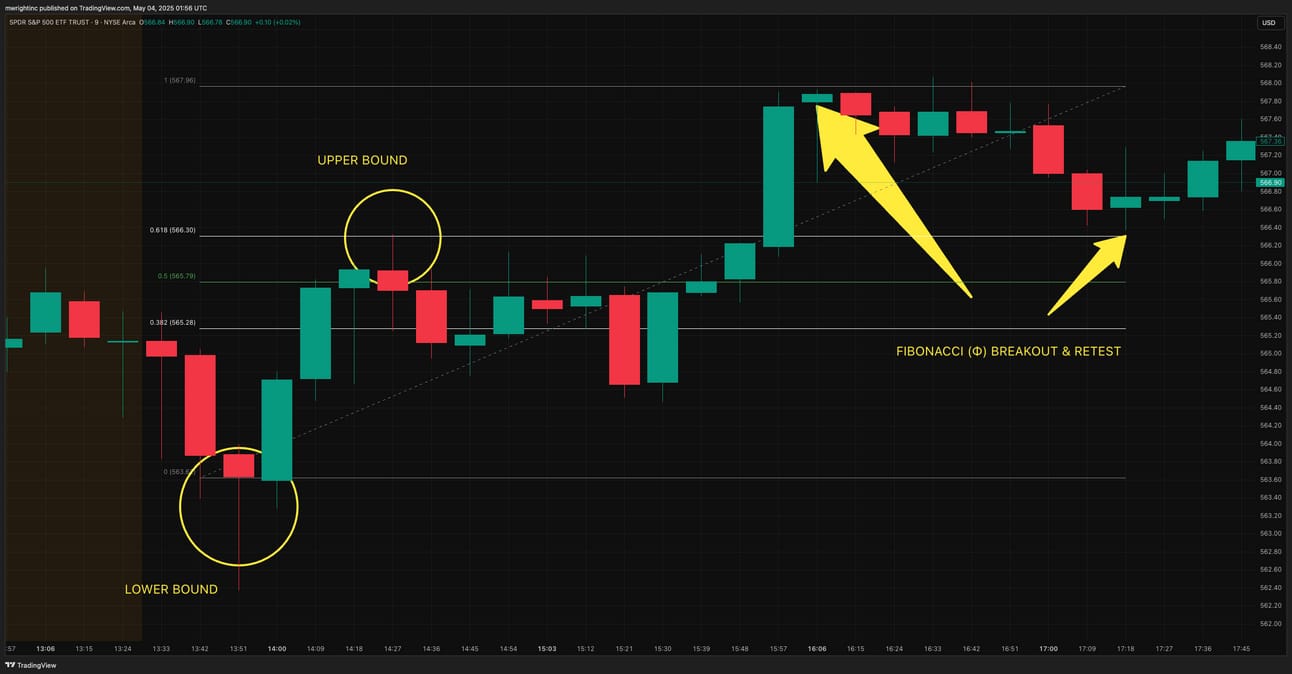
What exactly does this mean for charting stocks? For any price movement from any high to any subsequent low, or vice versa, if we consider that range to be a whole movement, and assign the entire movement a value of 1, then an infinite number of Φ (or Fibonacci), ratios exists within that range. The first being the range itself divided by Φ (1.618) or the range times the reciprocal of Φ (0.618).
Based on my earlier assumption, I believe that when we collectively see a retracement or bounce of 1/Φ it will appear as a movement of either 0.382 or 0.618 times the range - depending on the direction - and, because we have a physical response to this ratio, we become collectively aware that a significant point has been reached and we are compelled, as a group, to take action.
Likewise, when we see price escape a range, we tend to have a collective reaction once price moves Φ (1.618) times the range.
Just as your body reacts with a gasp (among other things) when you see a beautiful face, body, car, animal, painting, sculpture, flower, etc. we collectively have a physical reaction when we see charts make these types of price movements. Even more specifically, a Φ² number of participants may react and create a tipping point for price movement.
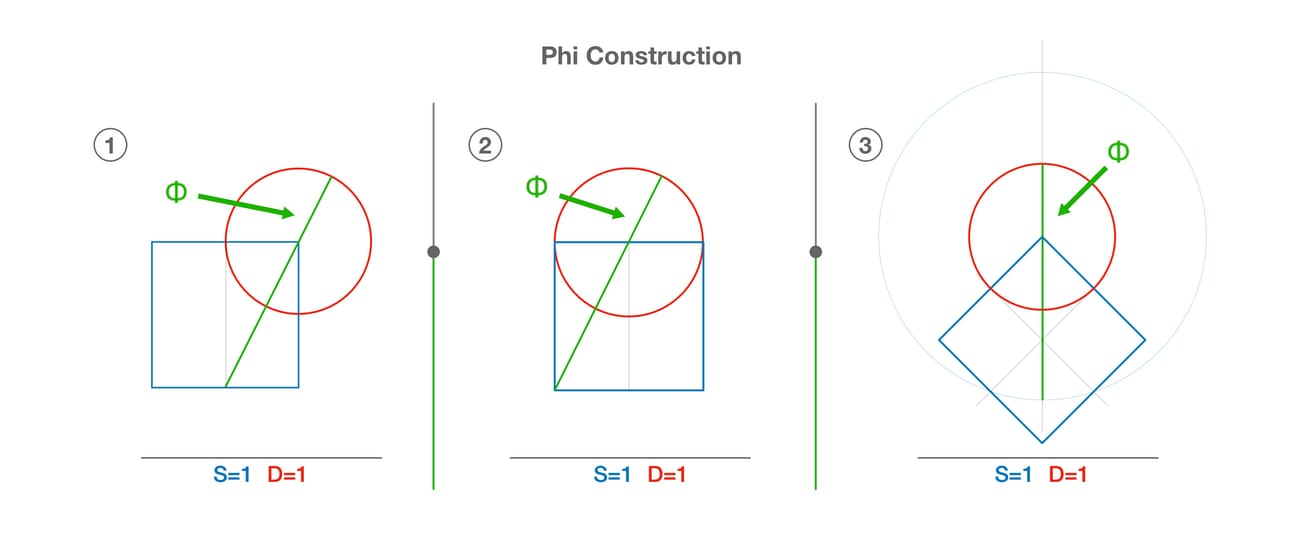
Mathematically, as I have discussed, Φ is a building block of nature. As well, geometrically, Φ, is a building block of nature. Especially when we consider that a circle is all of the points equidistant from a center point, and a square is the line between the center of 4 equidistant circles. 4 equidistant circles can be represented by 2 cellular separations (1 circle dividing itself followed by the 2 complete circles dividing themselves again). Simply put, if you start with a point and let it divide itself by natural processes, after the 2nd division, phi is present.
As far as we know, no other number creates this type of relationship, or these types of relationships. To add to this, like the number pi, phi is defined by a relationship between a square and a circle. Specifically, it can only be geometrically defined by a square with sides equal to 1 and a circle with a diameter equal to 1.
In summary, when you hear someone talk about 61.8% or 38.2% or Fibonacci retracement levels, they are basically saying that the price chart will have finished a cycle that a collective number of people will recognize and act on. Correspondingly, if price has reached all time highs, you can use the last low and high, and multiply that range by Φ to project where the next natural retracement could occur.
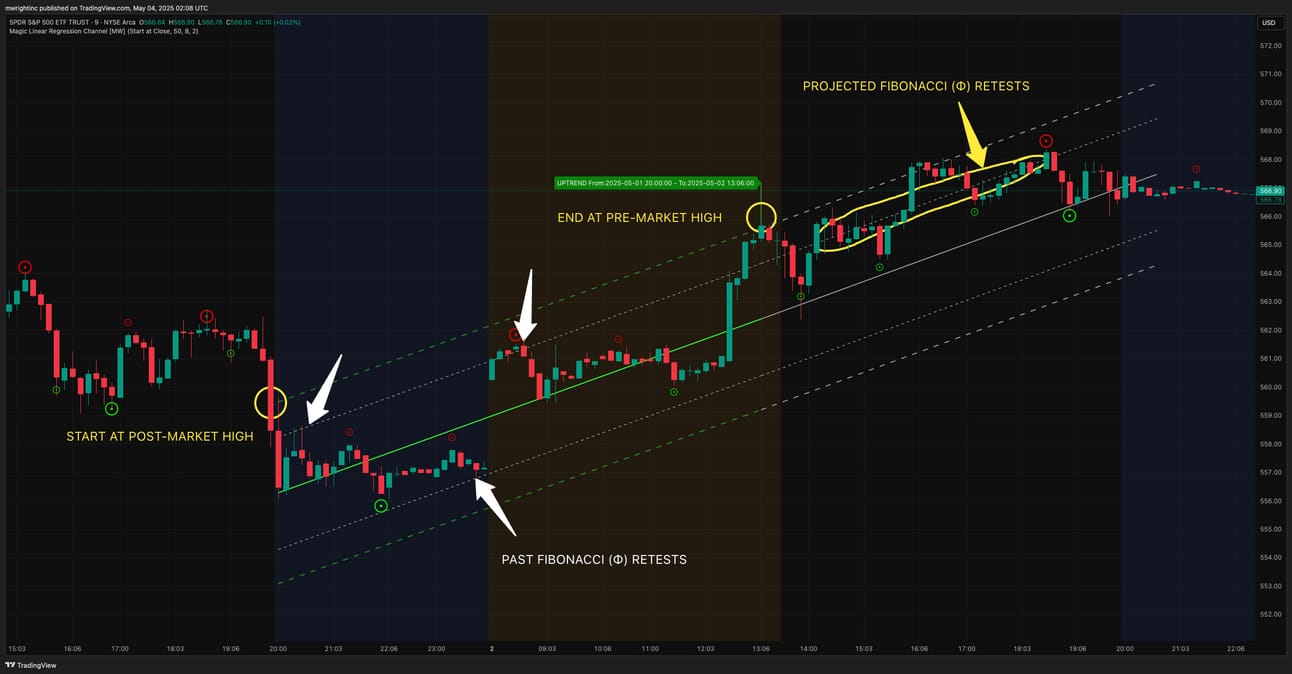
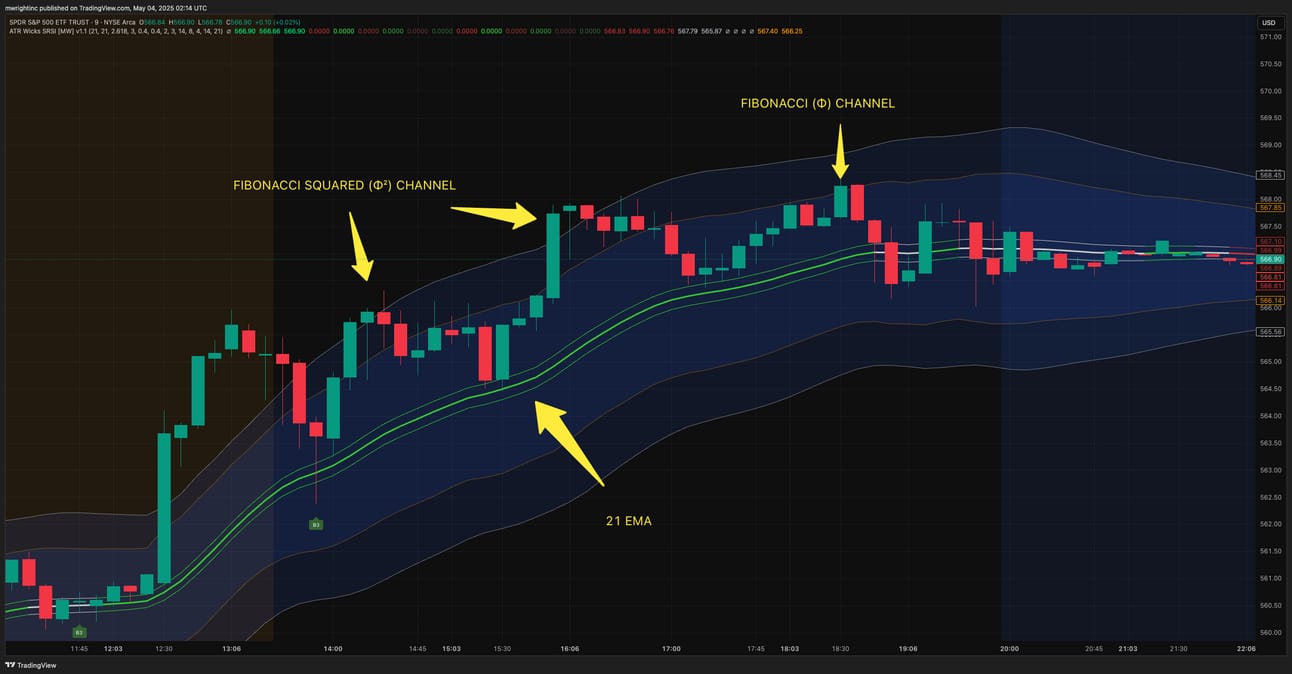
When I created the Magic Linear Regression Channel [MW], and the ATR Bands (Keltner Channel), Wick and SRSI Signals [MW] indicators, they were each built with the idea of using Φ values as boundaries for price movements. So, if you’ve gotten this far, and found my argument for Fibonacci levels compelling, make sure to add these two TradingView indicators to your arsenal.
$SPY ( ▲ 0.79% ) Analysis
In the last few days, $SPY has made up a lot of lost ground following a near 20% drop from it’s all time highs. Using the Magic Linear Regression Channel [MW], we see that the bounce occurred right at the baseline of the 10 year channel that we have been following all year. We suspected that a dead cat bounce could happen, but it remains to be seen whether it can keep up the bullish momentum.
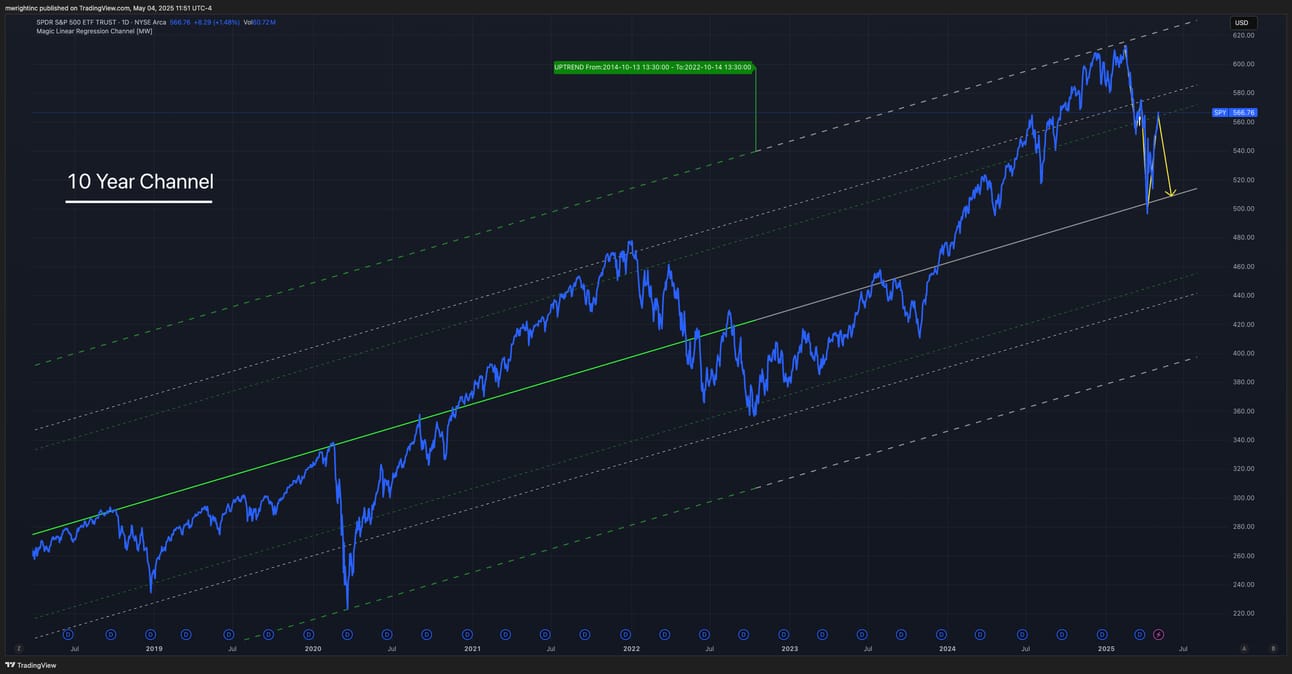
We are still in a bull market, but we are approaching resistance levels in the 10-year Magic Linear Regression Channel [MW], at halfway up the upper half of the channel, then at the upper Fibonacci level at $575. In the best-case scenario, I see consolidation within the upper half of the channel. In the worst-case scenario, we go back to the channel baseline and cut right through to $450. But, if price rises back above the Fibonacci level of $575 and holds, it could be a sign that the bulls have returned.
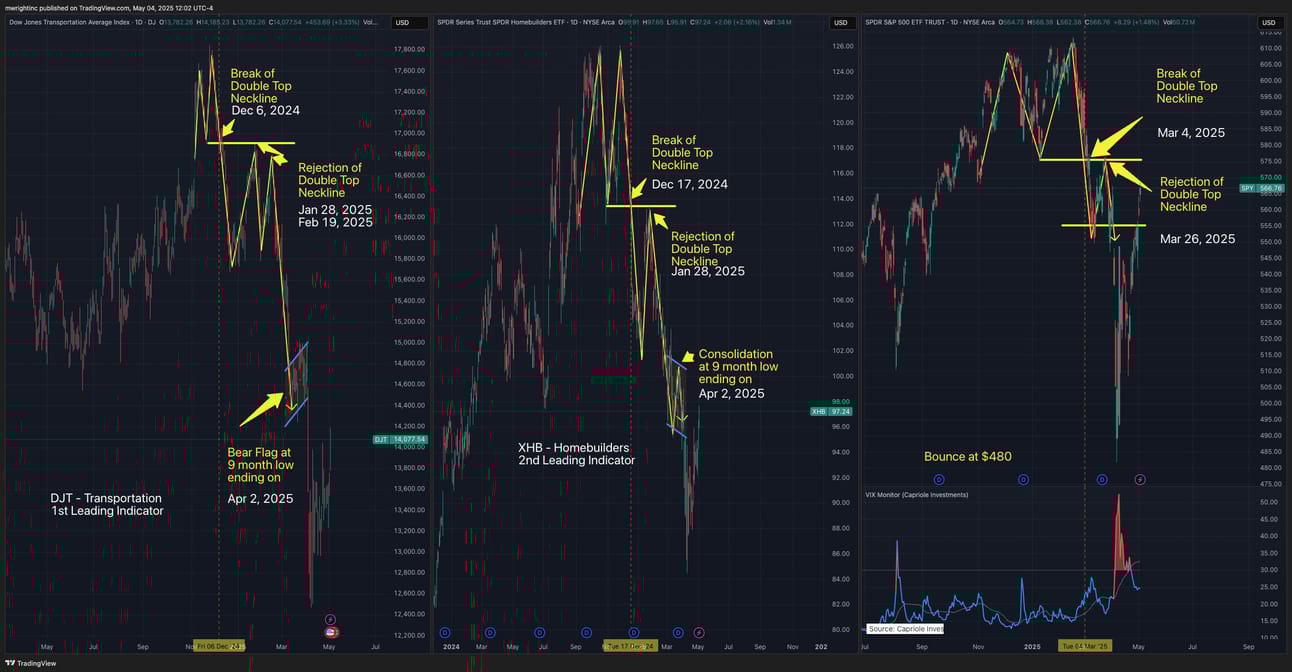
Looking at the transportation ($DJT) and homebuilders indices ($XHB) we see that $SPY, $DJT, and $XHB are all enjoying a rebound, but $DJT and $XHB have yet to recover their previous consolidation zones. On a positive note, we had a pretty monstrous spike in the $VIX at the lows that were generated, which can be a good contrarian sign that the worst is over. We shall see.
More Resources
Free TradingView indicators you can use right now in your account. Don’t have a TradingView account. Click this link to get one.
Magic Order Blocks [MW] https://www.tradingview.com/script/mC37KVoz-Magic-Order-Blocks-MW/
QQQ and SPY Price Levels [MW] https://www.tradingview.com/script/uthqQCwb-QQQ-and-SPY-Price-Levels-MW/
Magic Linear Regression Channel [MW] https://www.tradingview.com/script/qm2pmUW4-Magic-Linear-Regression-Channel-MW/
ATR Bands (Keltner Channel), Wick and SRSI Signals [MW] https://www.tradingview.com/script/lH6Yze4x-ATR-Bands-Keltner-Channel-Wick-and-SRSI-Signals-MW/
Bollinger Band Wick and SRSI Signals [MW] https://www.tradingview.com/script/cqTYgepJ-Bollinger-Band-Wick-and-SRSI-Signals-MW/
Price and Volume Stochastic Divergence [MW] https://www.tradingview.com/script/jnsqx9W9-Price-and-Volume-Stochastic-Divergence-MW/
Multi VWAP from Gaps [MW] https://www.tradingview.com/script/EqIgibII-Multi-VWAP-from-Gaps-MW/
Multi VWAP [MW] https://www.tradingview.com/script/L8cxNVC7-Multi-VWAP-MW/
MW Volume Impulse https://www.tradingview.com/script/c8A2cQb7-MW-Volume-Impulse/
The End
If you like this newsletter, let me know, and please share. If you don’t like it, please tell me why, and I’ll do my best to make it better. And remembre, if you have any questions, feel free to reach out to me on Reddit, X.com, TradingView, or Youtube. If for some reason you forget, you can always get those details from the footer at mwright.com