- Trading Advice for Losers
- Posts
- Position Sizing - Know Your "R"
Position Sizing - Know Your "R"
Why you should understand "Risk Units", Weekly Stock Picks, and $SPY Analysis
Mo Wright
March 23, 2025
⭐ Join our subscriber community at mwright.com ⭐
Introduction
Welcome back. In this issue we’ll be going over position sizing, and how to make it easy using PositionSizeCalculator.net. A must-have in your trading toolset. Additionally, we’ll look into the potential dead-cat bounce that $SPY had over the past week.
I am not an expert, and you should not treat any of what is said in this newsletter as financial advice. It’s just my opinion. The opinion of an average trader that has had some success, and many failures.
What makes my opinion different, though, is that I’ve spent the last two years coding trading indicators and strategies full-time to supplement my own trading. And, I’ve been building apps and websites since the browser was invented.
You can access all of the tools that I’ve built at https://mwright.com. Indicators. Calculators. Strategies. Browser extensions. Etc.
Like last week’s list, these four stocks have popped up a number of times in our X.com daily 100 Baggers posts. In reviewing their daily charts, they have all exhibited the same typical 100 Baggers patterns:
Above the 5 Day Simple Moving Average
Above the 50 Day Simple Moving Average
Above the 200 Day Simple Moving Averae
Above the 300 Day Simple Moving Average by 20% or more
Above the 1 Week VWAP
MACD (Moving Average Convergence Divergence) above its signal line
Additionally, each of these stocks seem to have at least a 10% move left before running into their next bearish order block.
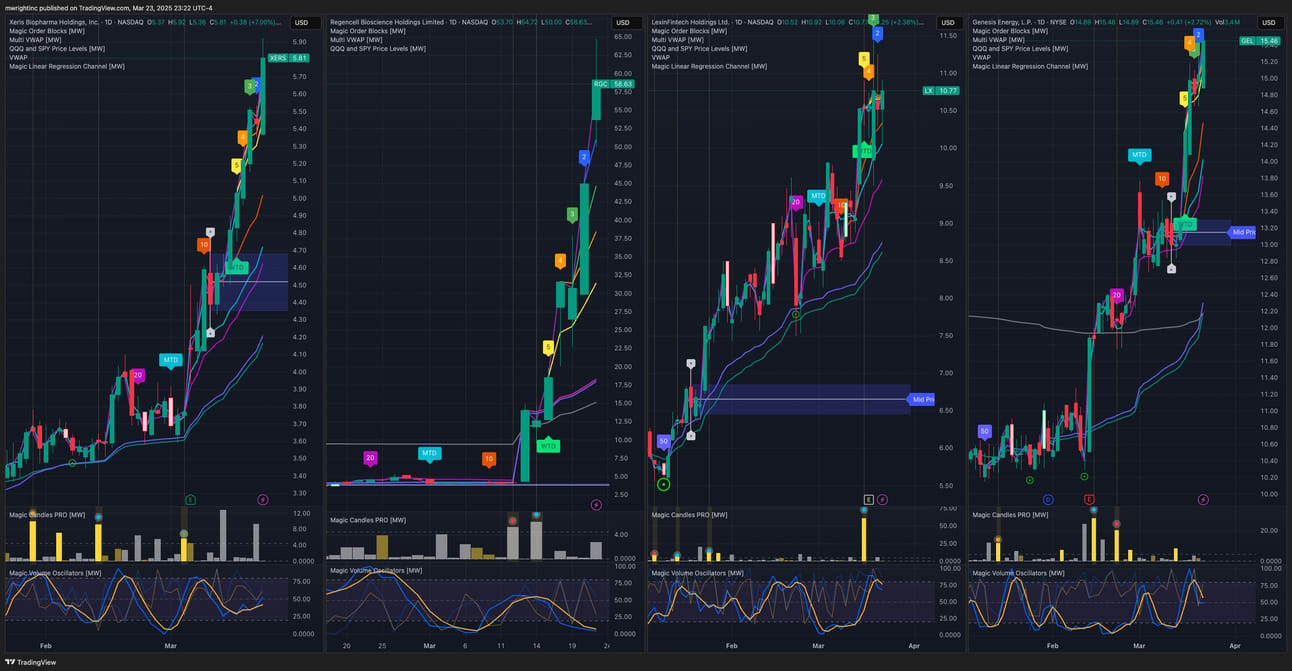
$XERS, $RGC, $LX, $GEL Charts
Position Sizing
When I began trading, I had what I now consider to be universal questions that are asked by beginner traders: “When do I get in?” and “When do I get out?” But, what I’ve found is that “How…” is actually a better way to begin each question.
As a novice, the first thing on our mind is getting the best timing so that we can get that elusive 1% a day every day. That mentality needs to be replaced as quickly as possible with first understanding the concept of position sizing and managing risk.
Position sizing, puts financial risk first and foremost. In this way of thinking the fundamental unit of any position is “risk amount”, or how much of your account you are willing to risk per trade. For any account size, this measurement should stay relatively consistent.
A good starting point is 2.5% per trade. What this means is that a major losing streak will not empty, or “blow up” your account. At least not quickly. You’ll need at least 20 bad trades in a row to accomplish that. And, one bad trade will very rarely cause any serious harm. Managing risk is the single most important part of trading that a newbie must understand.
When we talk about “risk units”, it refers to the dollar amount that that corresponds to that 2.5% per trade
When we talk about “risk units”, it refers to the dollar amount that that corresponds to that 2.5% per trade. With a $1000 account, that risk unit would be $25. Once you have your risk unit determined, then you can define your reward:risk ratio (we’ll refer to that as R:R going forward). A ratio of 2:1 means that for every $25 that you’re willing to lose, your target exit is twice that, or $50.
If you have a strategy that can win 1/3 of the time (33.3%), that means that for every 2 losing trades of $25, you’ll win at least one with a $50 profit, which would make your strategy breakeven (not including broker fees). That is, of course, not how you make money, but it is how you should think in order to avoid losing money. This, again, puts risk management as a priority.
Once you know at what rate your strategy should be winning, you can adjust your R:R percentage accordingly. If your strategy can produce winning trades 1/3 of the time (33.3%), and you have a 3:1 R:R ratio, with a $1000 account, your risk unit is $25 (2.5% of $1000) and your expected reward is $75 (3 times your risk unit). So, now, when you lose 2 trades and win one your profit is $75-$25-$25 or +$25, on average, over 3 trades.
As a trader, before entering any trade, knowing “How?” comes first. Once you get your head wrapped around that, then you can figure out what strategy you need to implement. You can have a high percentage strategy with a “low” R:R ratio. Or, you can learn a strategy that is lower percentage, but has the potential for a high R:R ratio.
There is an easier way to do all of this
For strategies with a high win percentage, you can use that on leveraged instruments like options or futures to get an even greater return. With leverage comes greater price movement, though, so make sure that your strategy is still valid for that combination of R:R, win percentage, and risk unit.
If you’ve made it this far, congratulations, there’s a reward for you. It can be a challenge to calculate R:R in your head or by hand, because you have to apply those numbers to the underlying asset - at its unique price - in order to set your stop loss and take profit orders (you should at least be doing the former). Although, spreadsheets are a great tool for building out your position before entering, they’re not the best. There is an easier way to do all of this.
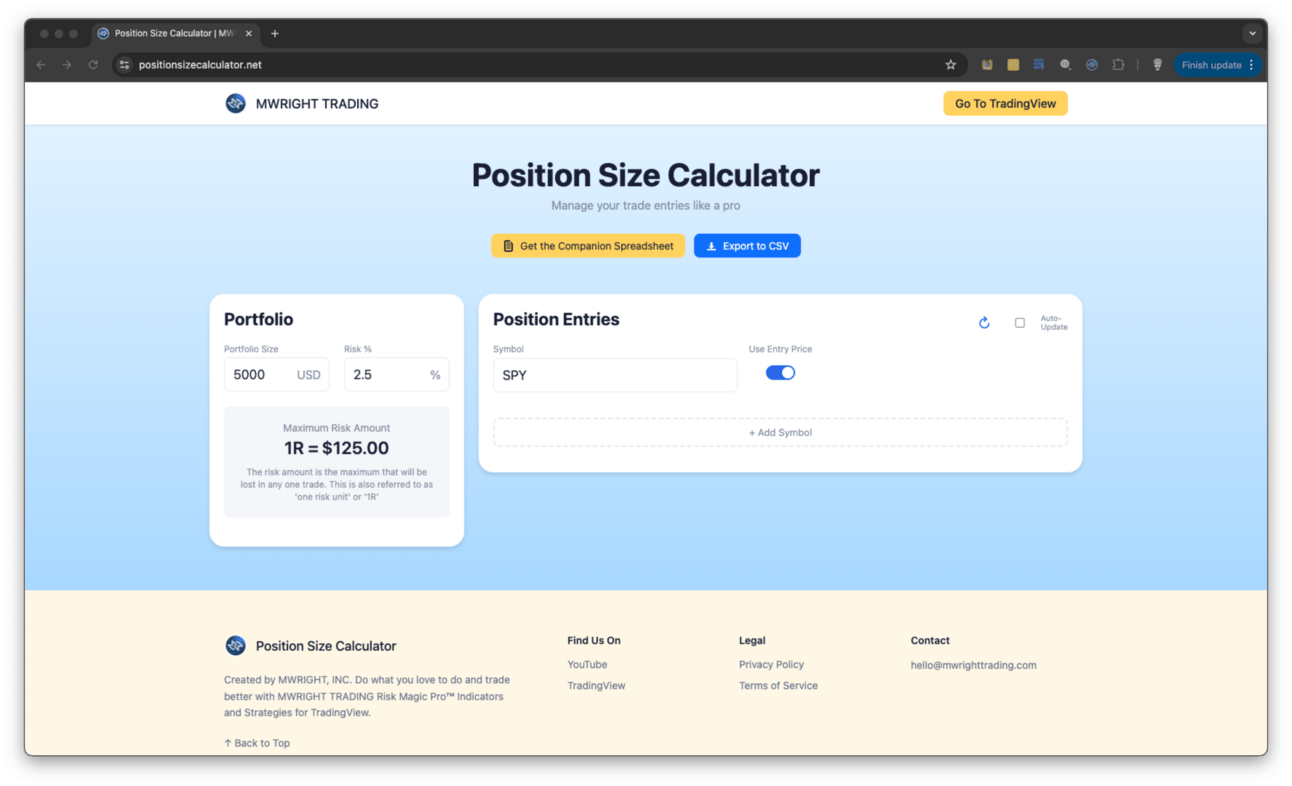
The best tool for position sizing stocks is PositionSizeCalculator.net
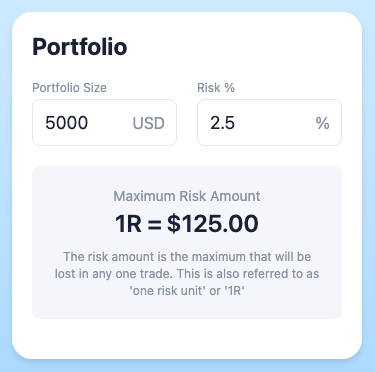
The best tool for position sizing equities is PositionSizeCalculator.net. There, you can set your risk percentage (the default is 2.5%) and account size (the default is $5000) to determine your risk unit. Then, you can choose an equity to build a position that assumes that you are entering at the current price of the equity.
A position-sized equity - automatically calculated
Because there are already default values, all you have to do is select the equity. Then, based on your account size, it will tell you
How many shares your account can afford?
At what price should you exit if it goes the wrong way, or the right way?
What are the equity’s prices that will give you a 1:1, 2:1, and 3:1 R:R ratio?
What are the equity’s prices that will give you a 1:1, 2:1, and 3:1 R:R ratio?
Like a spreadsheet, and unlike any other position size calculator, you can have as many rows of orders as you’d like. But that’s not even the best part. You can also show the stop-loss and take-profit prices for orders assuming an entry price of your choosing. The calculator can then visually show you how your position is performing. And, again, you can build as many rows of these positions as you want, unlike other free online calculators that can only show one position at a time.
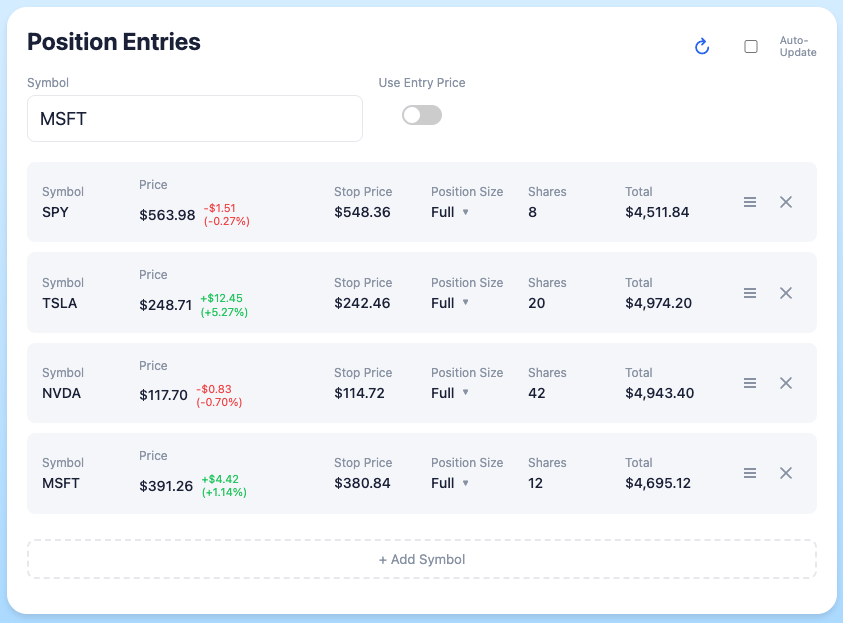
Like a spreadsheet, and unlike any other position size calculator, you can have as many rows of orders as you’d like
Once you have a position built out, if you are a TradingView user, you may want to look at the chart for the position. For that, there are direct links to the TradingView chart for the stock that you’ve built a position for. Just click on the ticker symbol.
Lastly, because you may not want to use the full value of your account for every trade, PositionSizeCalculator.net can size your trade to 1/2, 1/3, or 1/4 of your account size - while proportionately scaling down your risk unit - so that you can more easily manage multiple positions, as well as add smaller positions for setups that aren’t A+.
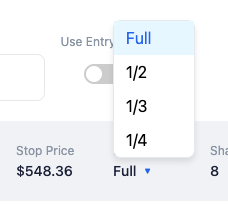
PositionSizeCalculator.net can size your trade to 1/2, 1/3, or 1/4 of your account size
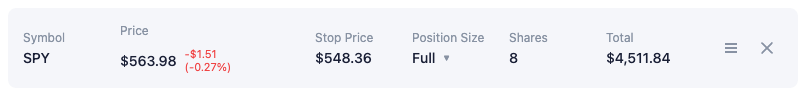
Let’s look at an example. Today, Sunday, March 23rd, 2025, $SPY currently is priced at $563.98. With a $5000 account, and a 2.5% risk percentage, the maximum risk amount is $125. These are default values in the Position Size Calculator. By typing “SPY” in the “Symbol” field, and selecting it when it appears, we can automatically generate a row that shows the:
Ticker symbol, which links to the corresponding TradingView chart
Current price and the day-to-day change in price
Stop price based on the risk unit
Position Size (How much of the total account value will be used in this position)
Calculated maximum total number of shares that can be bought
Total cost for those shares
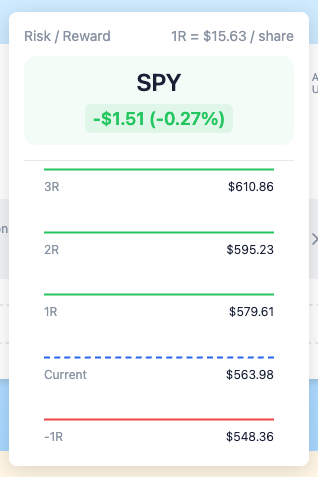
For each row, you get an icon that, when clicked, provides a clear representation of the -1R, 1R, 2R, and 3R values for the position
And, for each row, you get an icon that, when clicked, provides a clear representation of the -1R, 1R, 2R, and 3R values for the position. In this case, “R” is the absolute value of the risk unit, which, for this example, is $125. Given the amount of shares purchased, the -1R price, or $548.36 ($15.63/share) is the most that $SPY’s price can drop before the position MUST BE EXITED. On the other side, 1R gives your a 1:1 R:R ratio should price rise to $579.61. 2R is $595.23 and 3R is $610.86.
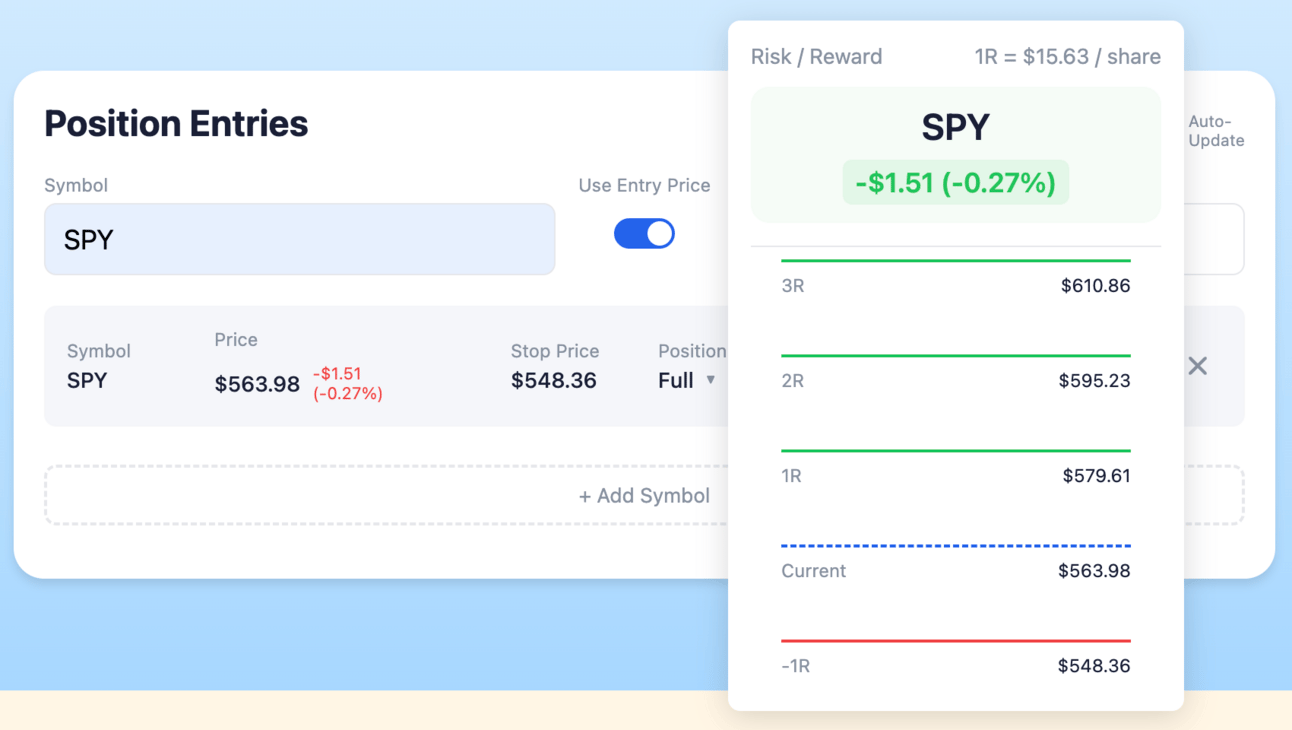
$SPY targets based on the current price
What your exit will be will depend on your trading strategy. You may use order blocks, VWAP, moving averages, or something else to determine when to exit or size down an order. What the calculator does, is help you find the nearest corresponding price that fits your strategy.
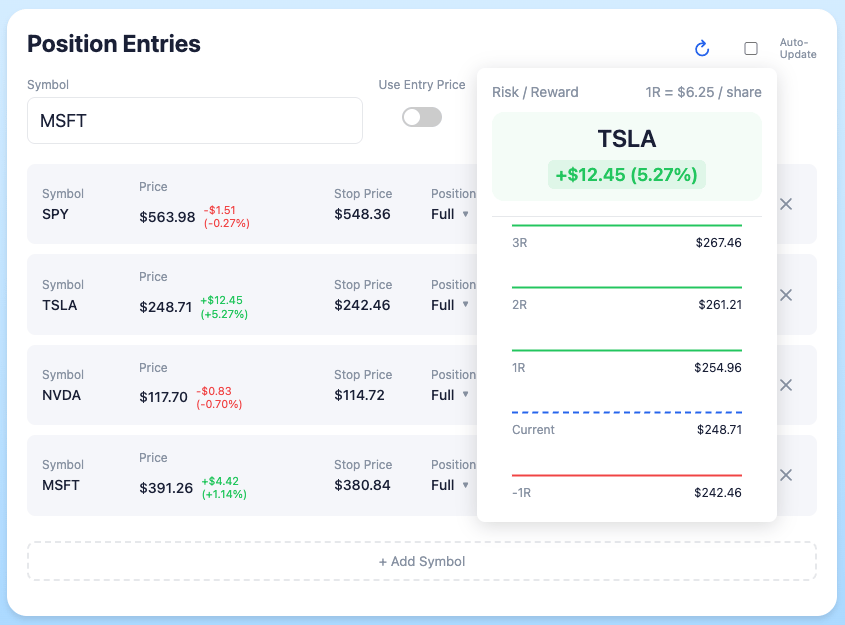
Additionally, the Position Size Calculator lets you define an Entry Price, in case you’re already in a position and want to know how it’s doing based on your portfolio size and risk %. To use this feature, click the “Use Entry Price” toggle, then enter the “Entry Price” in the new field that appears to the right. Once you’ve done that, press the return/enter key (or click the “+ Add Symbol” button), and a new row will appear that shows the same information as before - but based on your entry price.
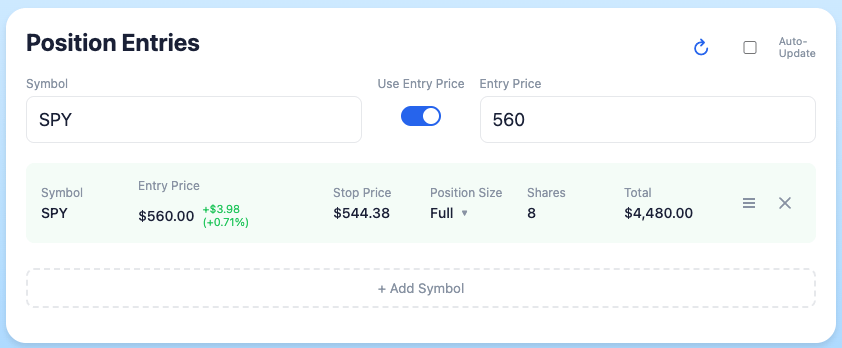
The Position Size Calculator lets you define an Entry Price
The new row will now be color-coded (green, if the trade is currently profitable, and red if the trade is currently at a deficit). For example, if I entered $SPY at $560 It will also show the:
Ticker symbol
Entry price and the change from the current price
Stop price, which is now 1R less than the entry price, rather than 1R less than the current price
Position Size
Calculated maximum total number of shares that SHOULD have been bought
Total cost for those shares.
And, as before, a pop-up that shows -1R, current price, 1R, 2R, and 3R prices. But, now it shows where the entry price is with respect to the current price, as well as with respect to the potential entry and exit points.
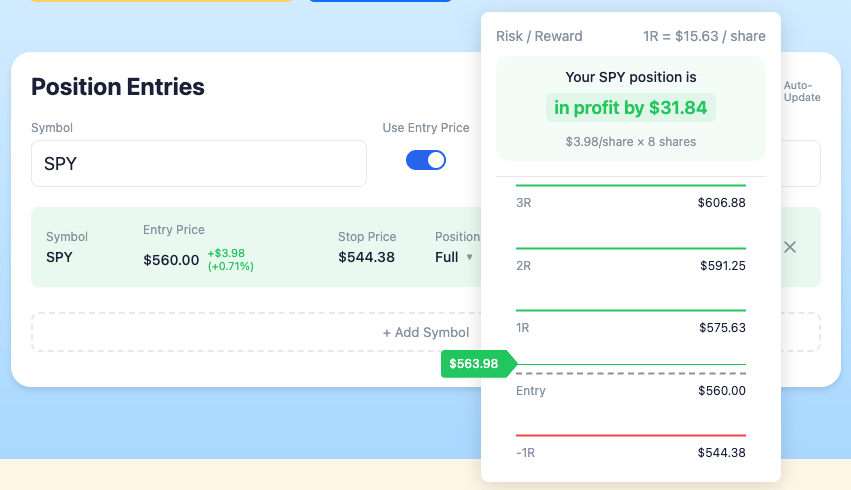
Entry price with respect to the current price
As mentioned above, if you’re day trading, and have multiple positions to manage, the Position Size Calculator can show them all at one time for easy reference, as well as give you simple visual cues for current profitability status, and where price has to move in order for you to exit.
In a nutshell, you don’t have to use PositionSizeCalculator.net to trade successfully, but success will rarely come if you don’t understand the “How” behind position sizing logic. Know the “How” behind calculating your “R”, and you will better be able to define the timing for whatever strategy you use.
For a walkthrough, you can watch the video at https://youtu.be/J_-1YvL0ZkA. You can also download a CSV-formatted file with all of your entries. And, for those who must have a spreadsheet, there is a companion Google Sheet that you can purchase access to at PositionSizeCalculator.net that has worksheets for current prices and for actual entry prices.
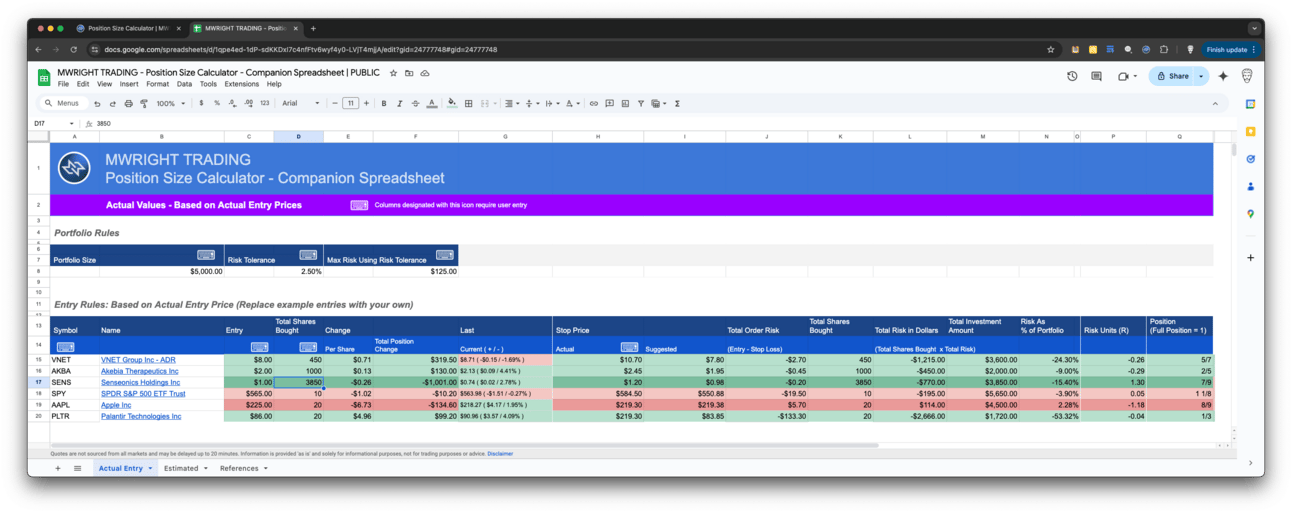
PositionSizeCalculator.net Companion Spreadsheet
$SPY Analysis
$SPY dipped below its 216 daily moving average and has been having a hard time recovering it, wicking it 4 times on the daily chart in the past 2 weeks. The 216 MA also coincides with the $571.50 Magic Order Block [MW] region that was set on Friday, March 7th, 2025.
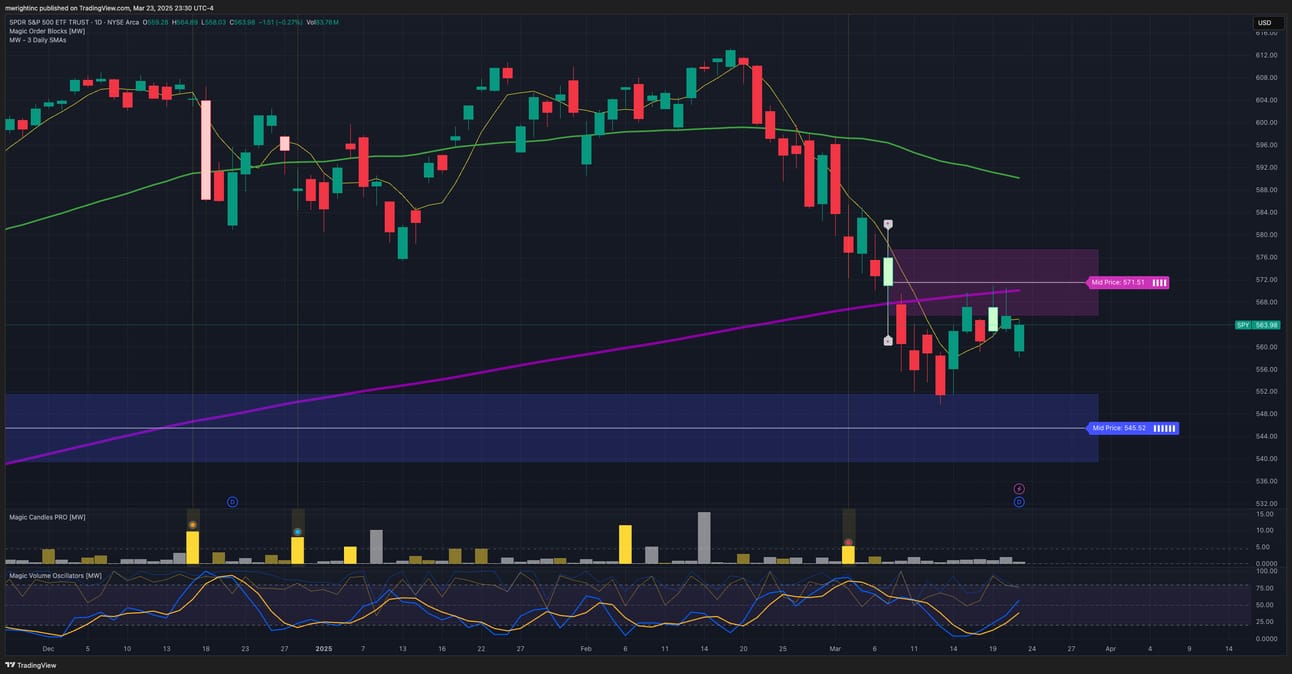
$SPY wicking the 216 daily moving average
Also, with the new volume oscillator signal that we’ve been testing, we can see that price is trending slightly down as volume is increasing, which likely means that more sellers are entering. If the price went down while the oscillator went down it would suggest that buyers are leaving. So, if more sellers keep coming in, then might be a sign that $SPY has further to fall, which is what was covered in the last newsletter.
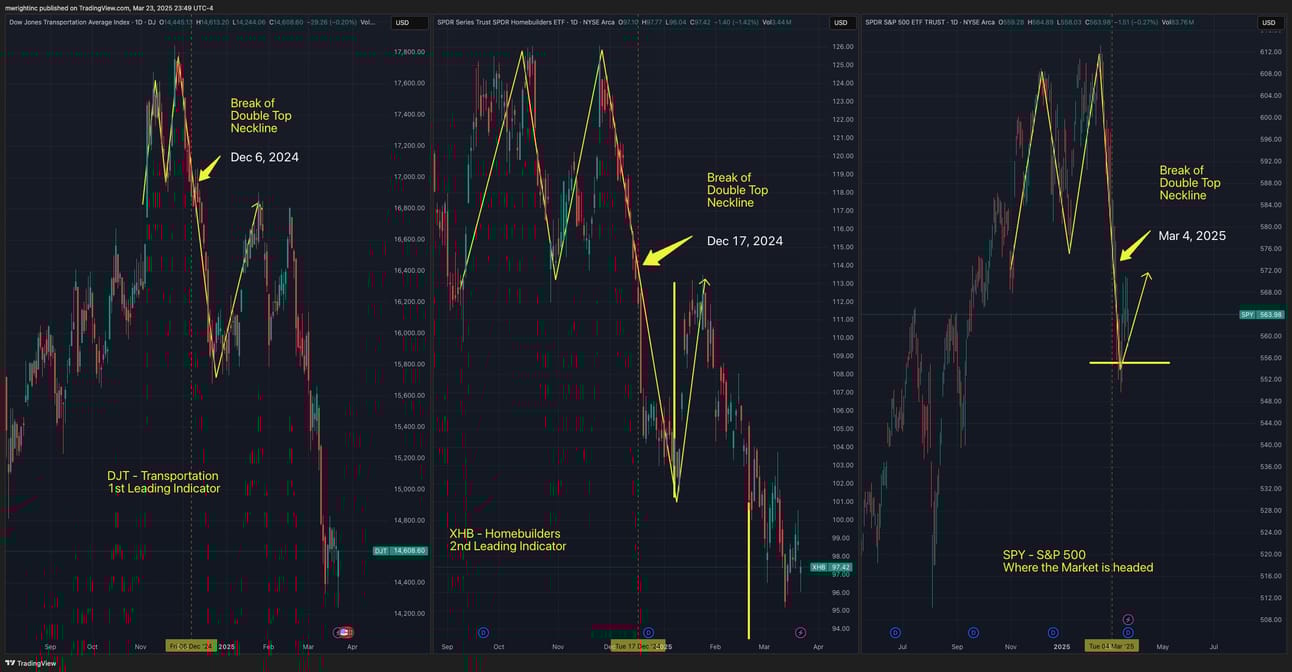
$DJT, $XHB, and $SPY
The thought was that $SPY could get to $575 to $580 before rejecting (after it dropped to $555), but $570 might be all that there is to give. At best, $SPY could still potentially hit that $575 to $580 zone, but it’s starting to look more likely that it will head down to $545 ($545.51 specifically), which is the nearest bullish order block.
More Resources
Free TradingView indicators you can use right now in your account. Don’t have a TradingView account. Click this link to get one.
Magic Order Blocks [MW] https://www.tradingview.com/script/mC37KVoz-Magic-Order-Blocks-MW/
QQQ and SPY Price Levels [MW] https://www.tradingview.com/script/uthqQCwb-QQQ-and-SPY-Price-Levels-MW/
Magic Linear Regression Channel [MW] https://www.tradingview.com/script/qm2pmUW4-Magic-Linear-Regression-Channel-MW/
ATR Bands (Keltner Channel), Wick and SRSI Signals [MW] https://www.tradingview.com/script/lH6Yze4x-ATR-Bands-Keltner-Channel-Wick-and-SRSI-Signals-MW/
Bollinger Band Wick and SRSI Signals [MW] https://www.tradingview.com/script/cqTYgepJ-Bollinger-Band-Wick-and-SRSI-Signals-MW/
Price and Volume Stochastic Divergence [MW] https://www.tradingview.com/script/jnsqx9W9-Price-and-Volume-Stochastic-Divergence-MW/
Multi VWAP from Gaps [MW] https://www.tradingview.com/script/EqIgibII-Multi-VWAP-from-Gaps-MW/
Multi VWAP [MW] https://www.tradingview.com/script/L8cxNVC7-Multi-VWAP-MW/
MW Volume Impulse https://www.tradingview.com/script/c8A2cQb7-MW-Volume-Impulse/
The End
If you like this newsletter, let me know, and please share. If you don’t like it, please tell me why, and I’ll do my best to make it better. And remembre, if you have any questions, feel free to reach out to me on Reddit, X.com, TradingView, or Youtube. If for some reason you forget, you can always get those details from the footer at mwright.com