- Trading Advice for Losers
- Posts
- Order Blocks - The Most Reliable Indicator
Order Blocks - The Most Reliable Indicator
All timeframes. All assets.
Mo Wright
March 16, 2025
⭐ Join our subscriber community at mwright.com ⭐
Introduction
Welcome back. In this issue we’ll be going over Order Blocks. And, more specifically, our Magic Order Blocks [MW] indicator on TradingView. What I consider to be THE most reliable indicator. Additionally, we’ll look at the eerily similar correlation between $SPY and the transportation ($DJT) and hombuilders ($XHB) indexes.
I am not an expert, and you should not treat any of what is said in this newsletter as financial advice. It’s just my opinion. The opinion of an average trader that has had some success, and many failures.
What makes my opinion different, though, is that I’ve spent the last two years coding trading indicators and strategies full-time to supplement my own trading. And, I’ve been building apps and websites since the browser was invented.
You can access all of the tools that I’ve built at https://mwright.com. Indicators. Calculators. Strategies. Browser extensions. Etc.
These four stocks have popped up a number of times in our X.com daily 100 Baggers posts. In reviewing their daily charts, they have all exhibited the same typical 100 Baggers patterns, and one very important additional one:
Above the 5 Day Simple Moving Average
Above the 50 Day Simple Moving Average
Above the 200 Day Simple Moving Averae
Above the 300 Day Simple Moving Average by 20% or more
Above the 1 Week VWAP
MACD (Moving Average Convergence Divergence) above its signal line
These are the foundation 100 Baggers Criteria. What struck me was that these patterns were being generated while $SPY was undergoing its biggest crash in years. Meaning that these were ambivalent, or unfazed, by what was going on in the general market. Being agnostic to $SPY price actions during a downturn is a good thing.
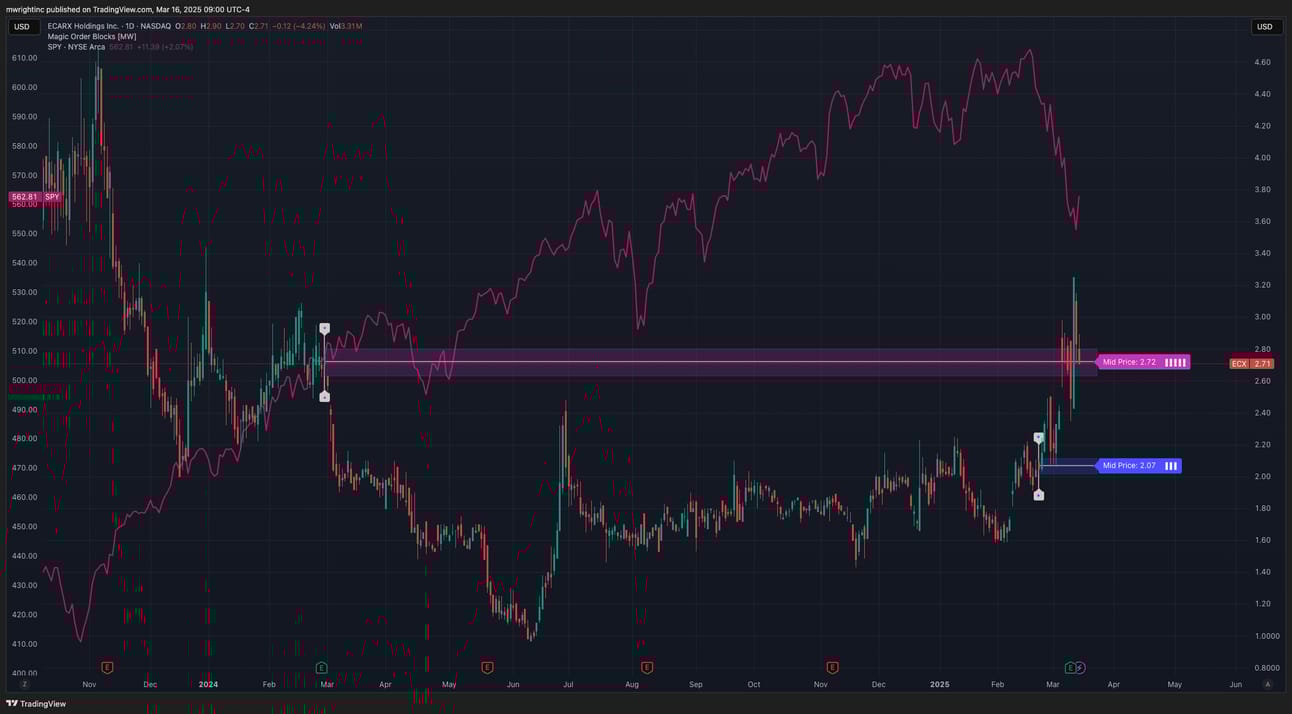
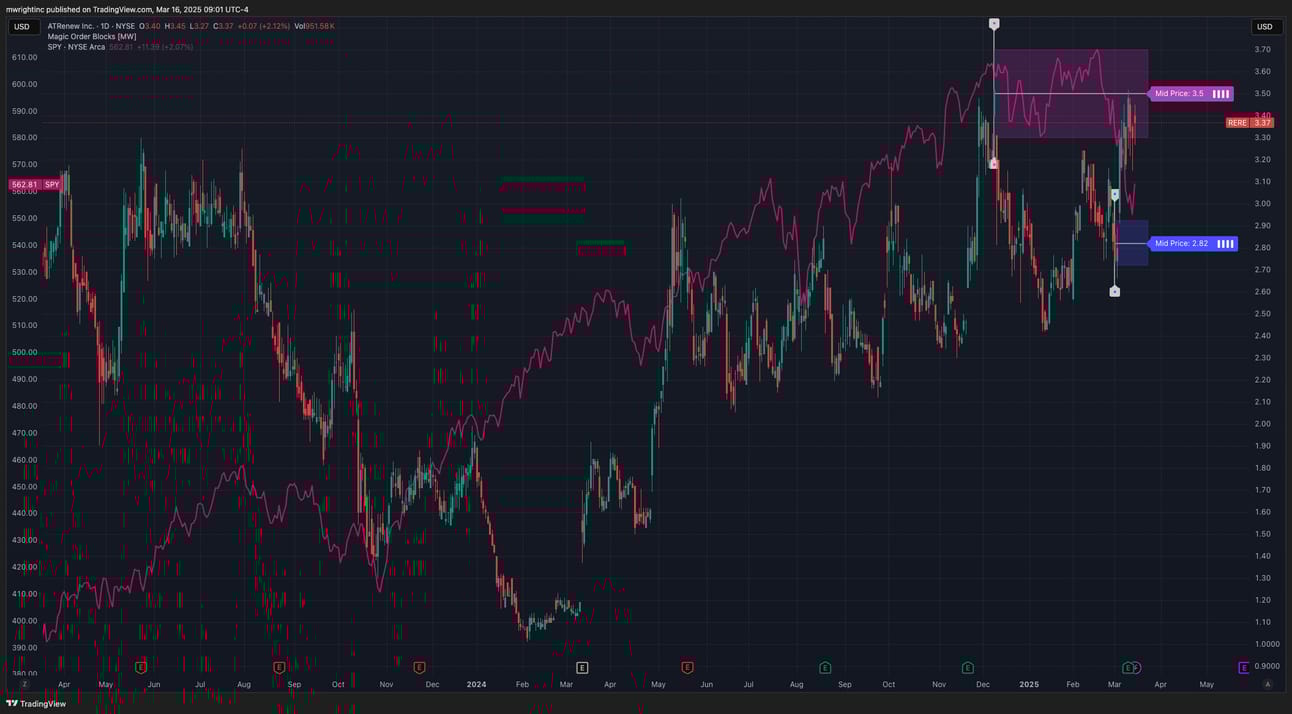
$RERE - Compared to $SPY and with Magic Order Blocks [MW]
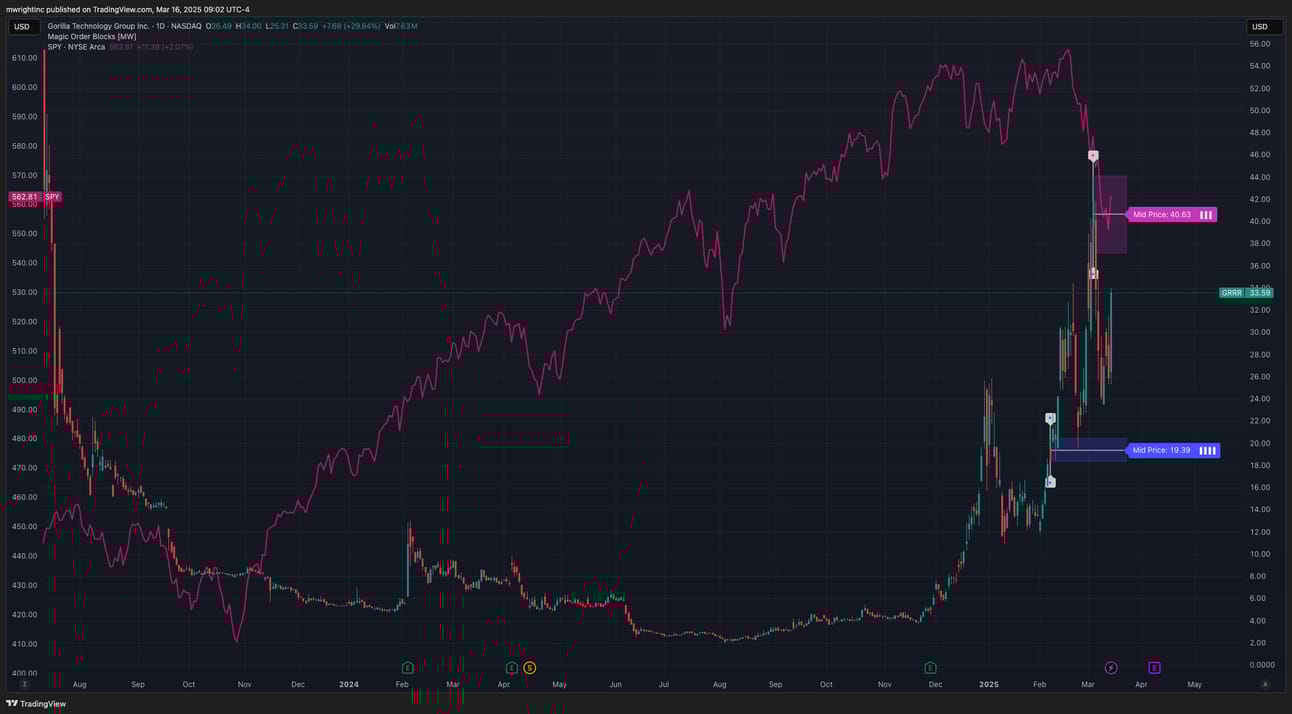
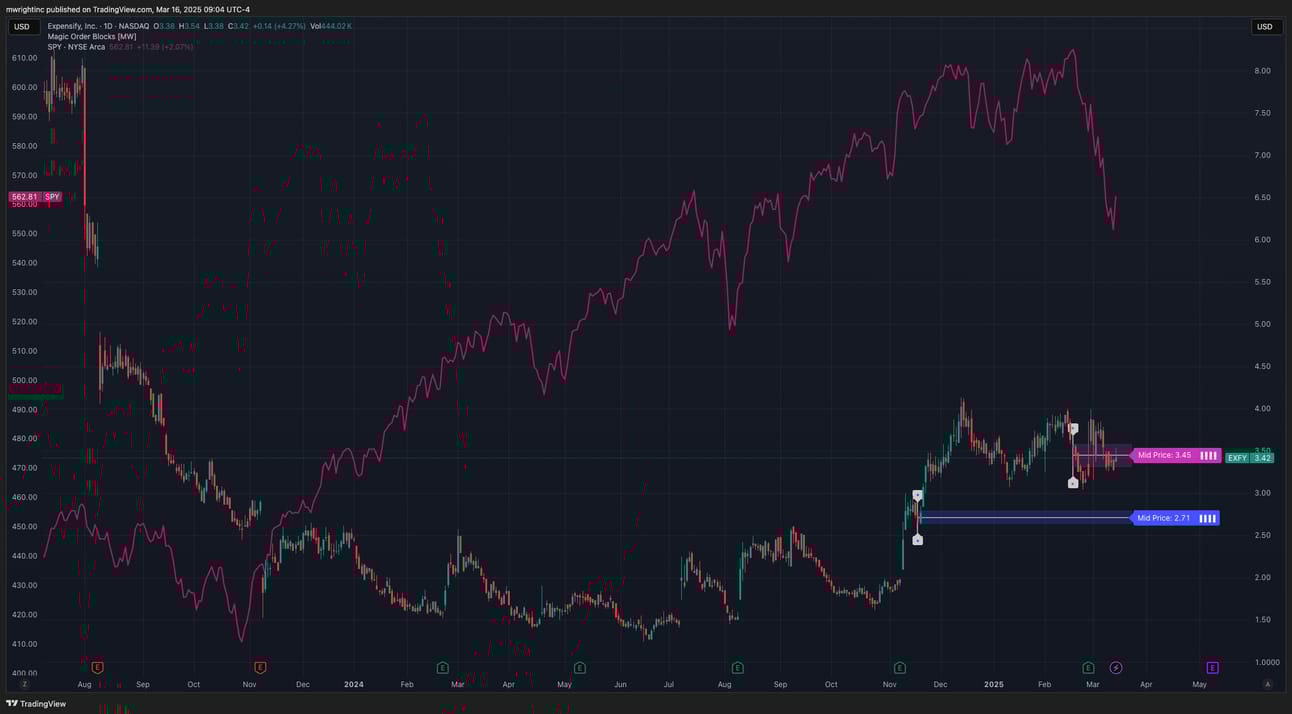
What you may have noticed is that each of these stocks have either had a small rejection from, or are consolidating near an order block. What does that mean? Read on to find out.
Order Blocks and the Magic Order Blocks [MW] Indicator on TradingView
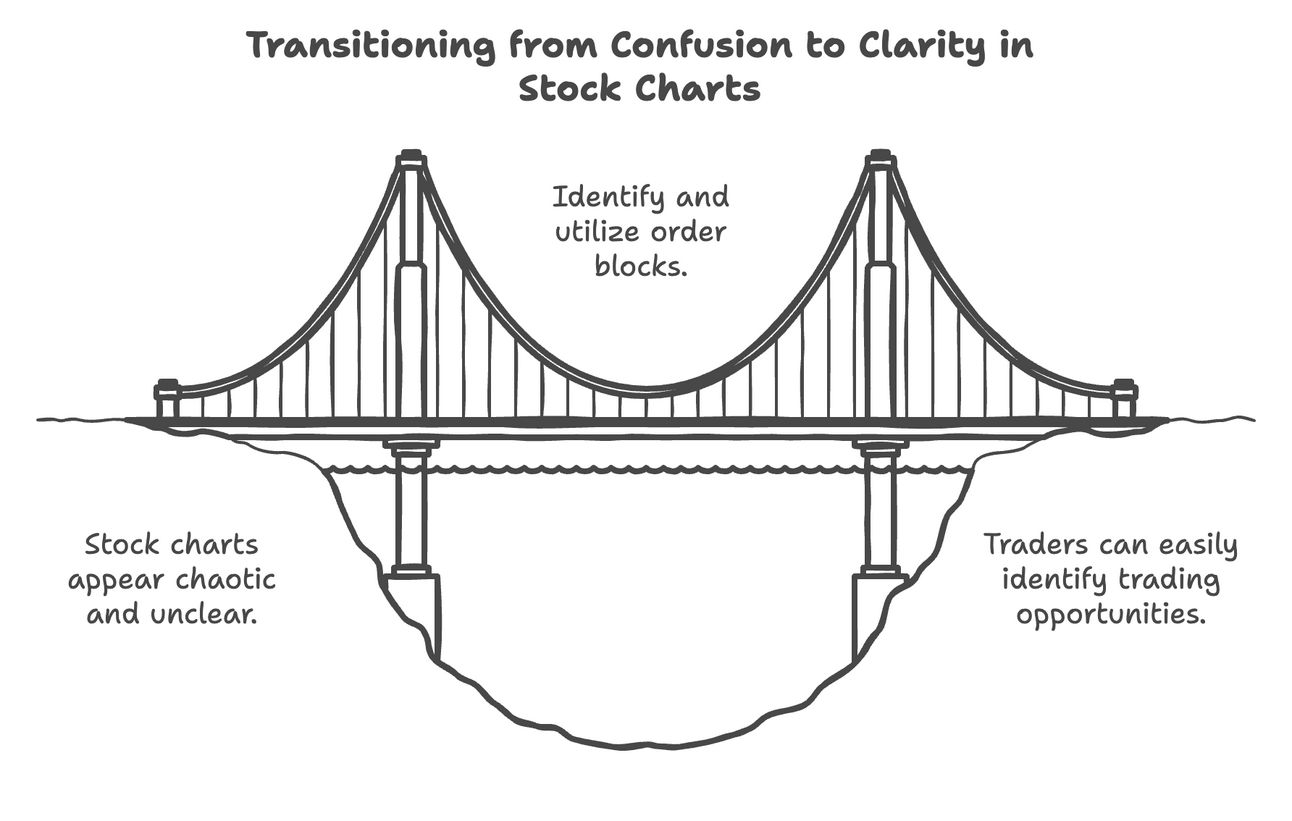
When I first started looking at charts it was difficult distinguishing what constituted a pattern. At least one that could be discerned from looking at candlesticks. Since then, there has been one that has stuck out from everything else: order blocks.
Order blocks are formed when price direction changes abruptly. It means that, in spite of the market continuing to go in one direction, there was a big enough player that came on the scene that was able to shift the entire market, and create “consecutive” candles in the opposite direction. The candle prior to this direction change defines the price range of the order block.
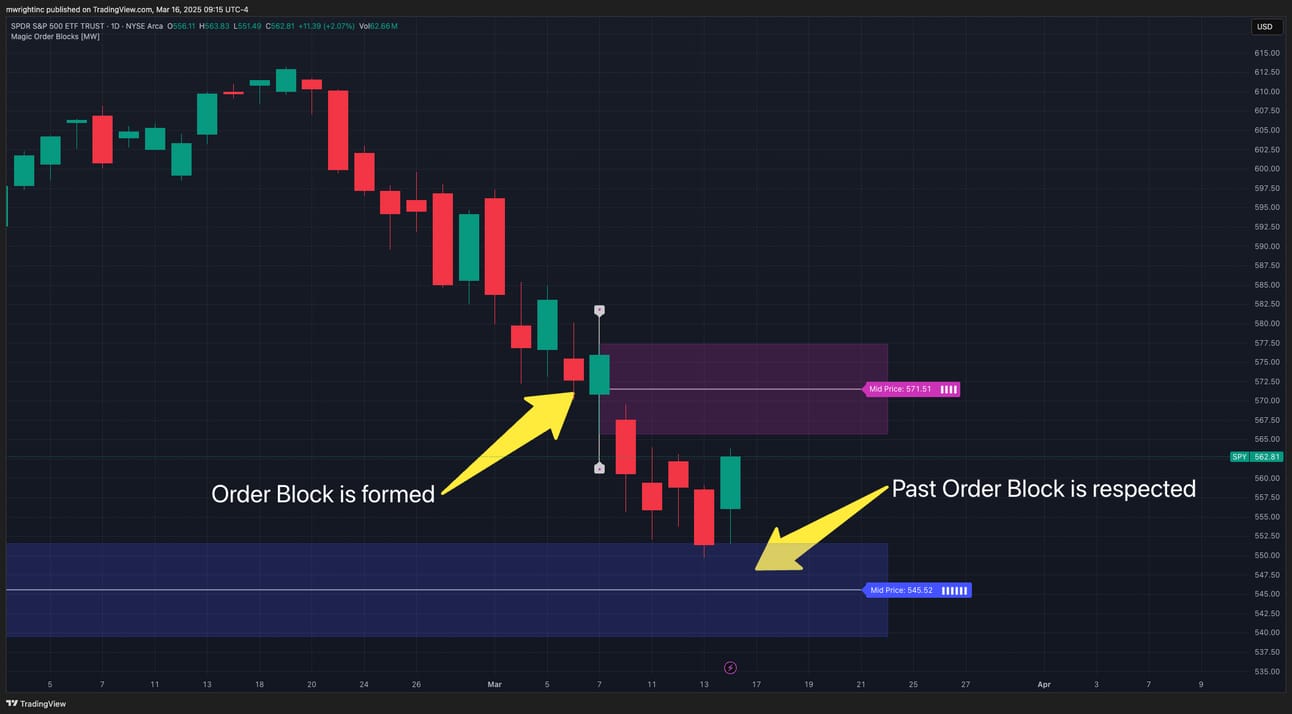
For example, if the price of $SPY is rising, then reverses direction at $593.12, then the last candle that was formed gives the high and low of the order block.
Because, an order block is defined by a direction change, one could be formed even when price is going sideways. In other words, it has changed much for an extended period of time. When that drastic change does happen, then the last candle that formed that was in the opposite direction of the new change IS the order block.
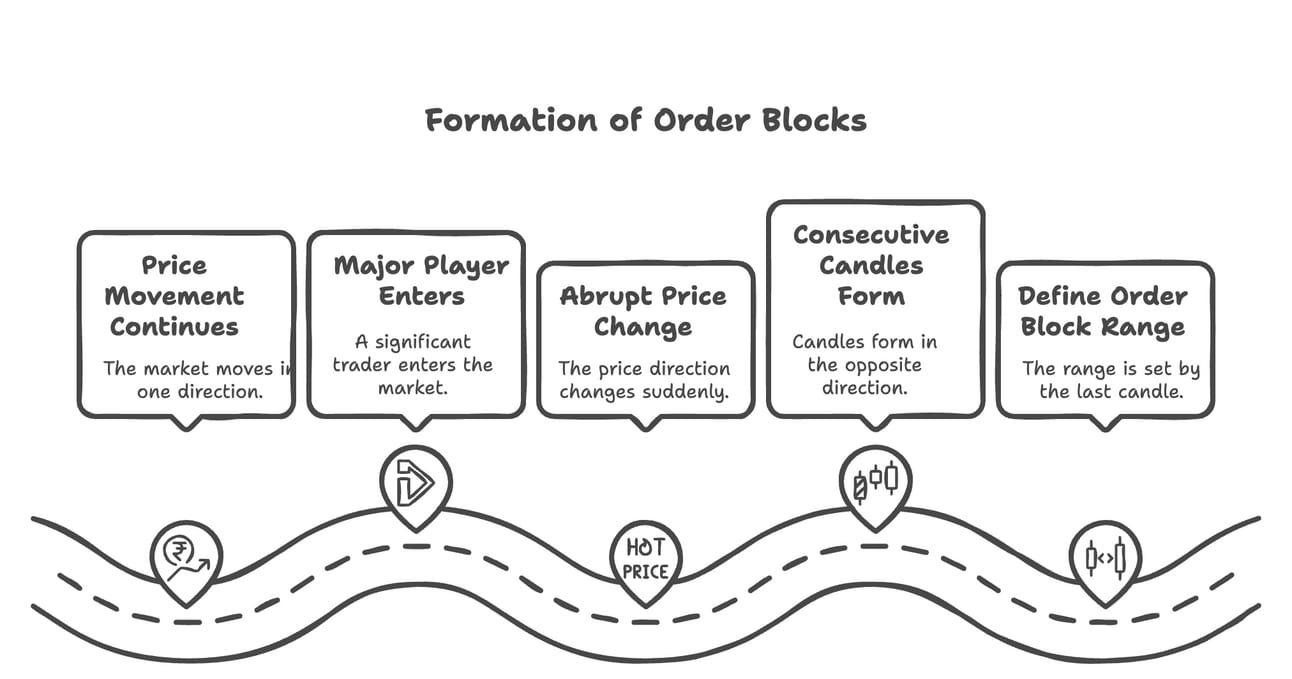
Formation of Order Blocks
So, “What constitutes a “big” or “drastic” or “abrupt’ change?” you may ask. Well, that’s why we have the Magic Order Blocks [MW] indicator. It gives you the ability to define how many “consecutive”, same color candles should be considered when defining when an order block was formed.
You can define it in terms of the total number of consecutive candles, or by the total price change covered by the consecutive candles, or by a combination of both.
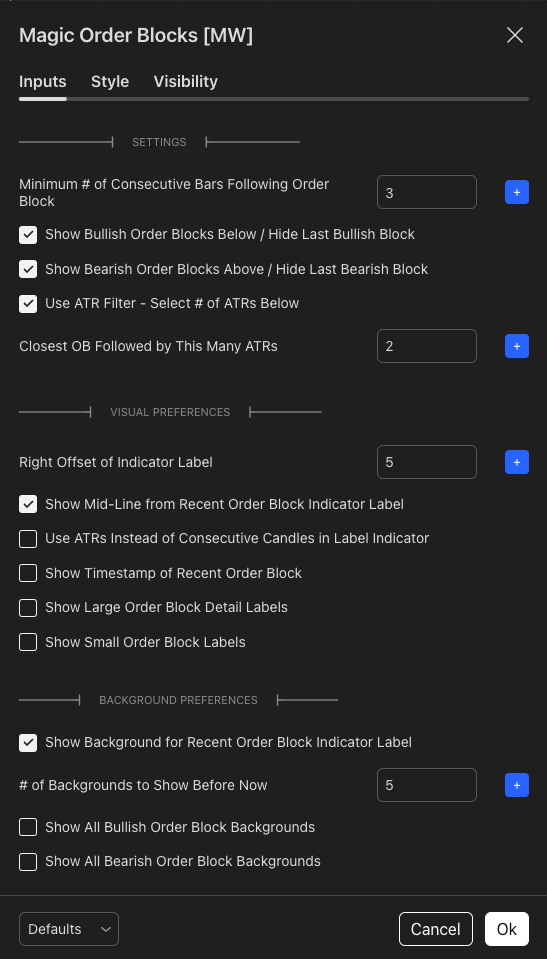
Magic Order Blocks [MW] Indicator Settings on TradingView
Let’s say that the price of $SPY is just floating along, without a care in the world, then all of a sudden a whale shows up (someone with a big order) and pulls the rug out on the price and it drops $2 from $590, to $588 over the course of 6 consecutive red candlesticks. And that price movement covers an Average True Range (ATR) of 4 (I.e. 4 average size candlesticks).
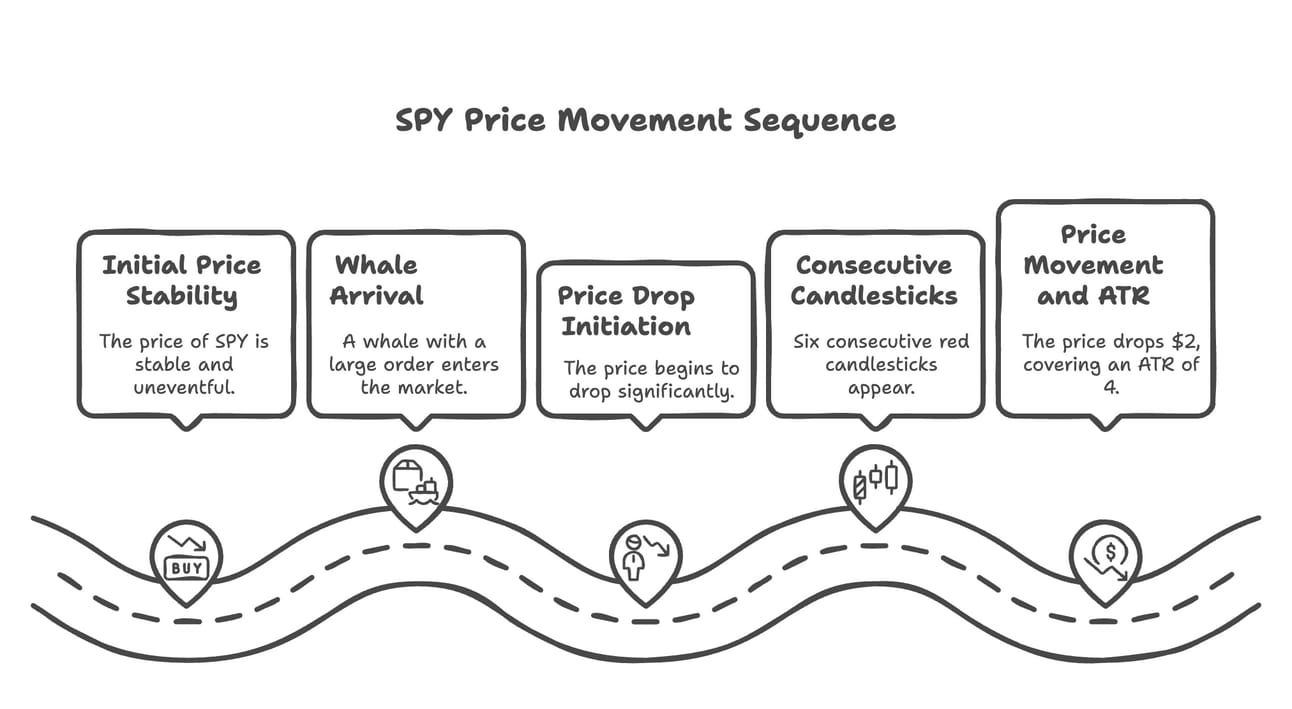
$SPY Price Movement Sequence
The Magic Order Blocks [MW] indicator can either filter out
Price changes that include a selected number of consecutive candles
Price changes that cover an amount that is a multiplier of the ATR, or Average True Range of each candle.
Price changes that cover a number of selected candles, and traverse a certain number of average size candles.
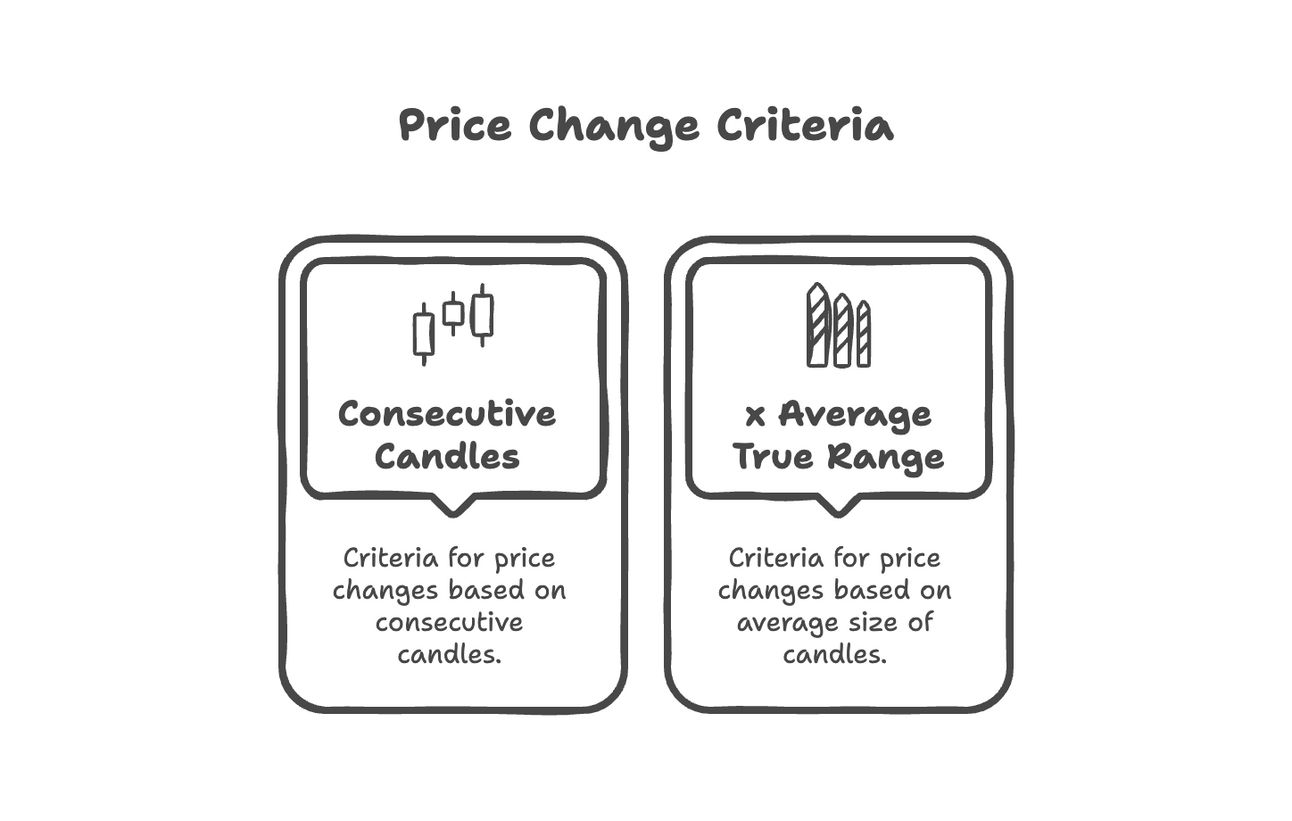
Price Change Criteria
In our example we had 7 candles that covered 4 ATRs. If we define limits of 4 and 4, respectively, then we have defined the requirements of all order blocks. If we only want to count really big moves, we can make those numbers larger. Or, if we want to make it more sensitive we could use smaller values, like 4 candles and 2 ATRs for example.
“Why should order blocks be useful for anything? You don’t know an order block is forming when it begins, and even if you did know, guessing how big it will be is really just guessing, right?” That is correct. An order block only indicates what has happened in the past. It does not guarantee that the same price action will occur when the order block price range is encountered again. But, recall that the price change was drastic, which likely “trapped” a lot of market participants at a price that they couldn’t get out of.
Imagine you bought a car, and was planning on selling it, but the market price dropped so fast that you couldn’t sell it at the price you wanted to. So, since you don’t want to miss the opportunity the next time around, you sell it as soon as people are willing to pay your asking price again. So, although order blocks can’t predict price action, they can give you some insight into the motivations of other market participants. Oh, and then there is “The Whale”. The person, or organization, or algorithm whose large order created the order block in the first place. They might still be there … waiting … at that exact same price!
Like any indicator, or technical analysis rule, nothing is guaranteed. But, I tell you this,
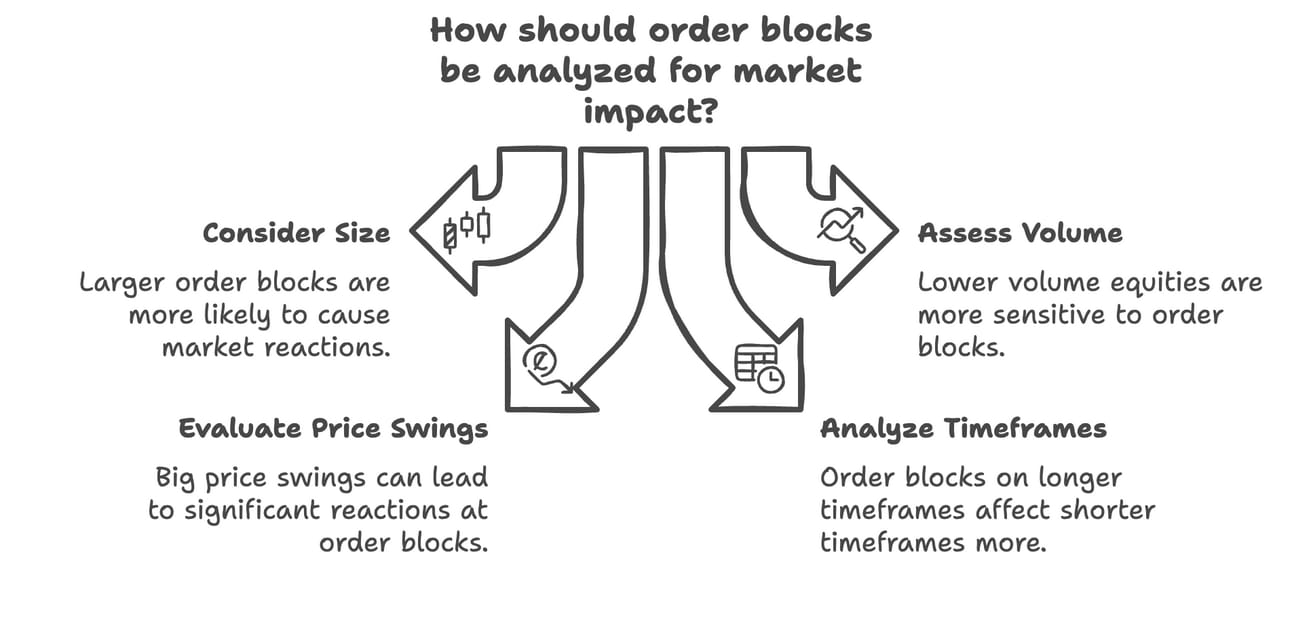
Some general rules of thumb that we like to use are:
The bigger the order block (in terms of consecutive candles and ATRs) the more likely it is to cause a reaction.
Lower volume equities, like small caps, are more sensitive to order blocks, because the presence of a big player has more of an impact.
A BIG price swing can have an equally big reaction if it runs out of steam at an order block.
Order blocks on longer timeframes can have a more pronounced effect on shorter timeframes.
Hopefully, that adds some clarification to why we consider Magic Order Blocks [MW] to be our most reliable indicator. Now, you can review the charts for our weekly stock picks and determine how Order Blocks might be affecting the price right now, and how they might impact price action going forward.
$SPY Analysis
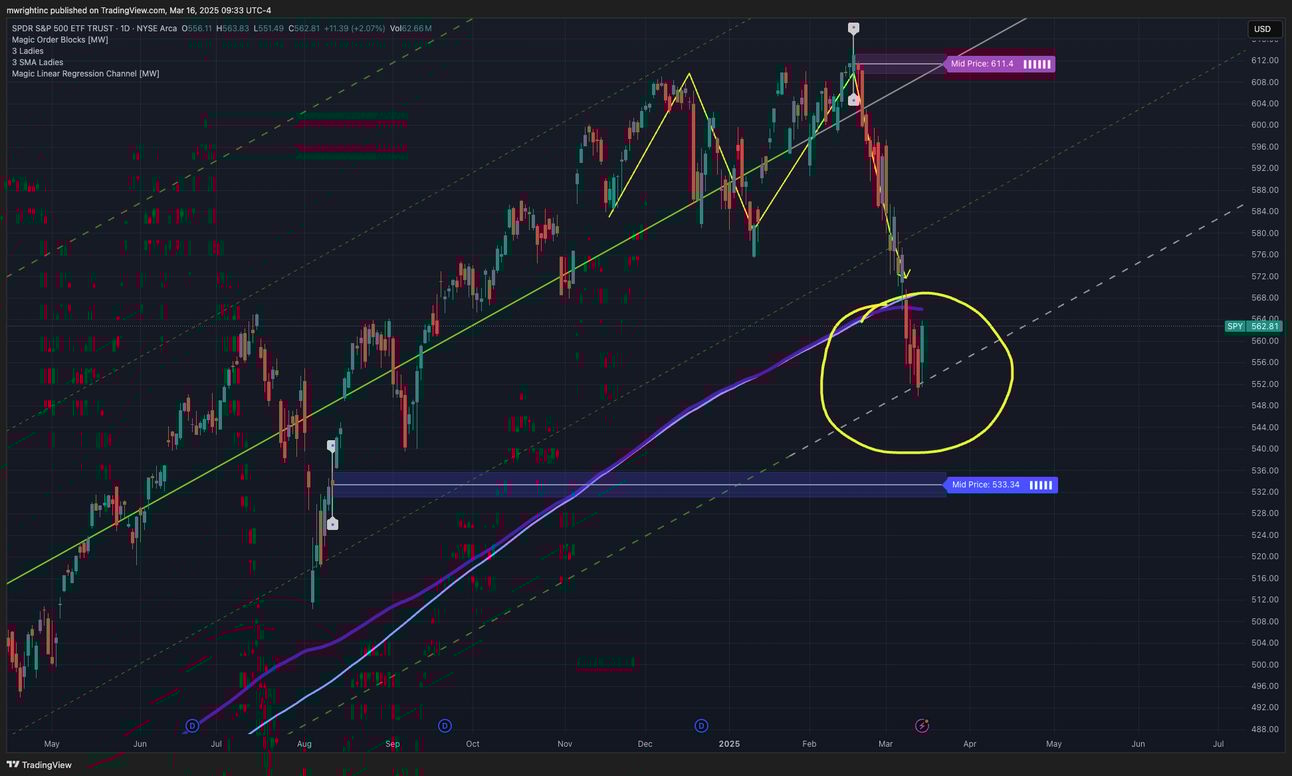
$SPY Rejection at the bottom of the 3-Year Magic Linear Regression [MW] Channel
On Friday, March 14th, 2025, $SPY ignored the 216 Simple Moving Average and 216 Exponential Moving average and bounced right at the bottom of the 3-Year Magic Linear Regression [MW] Channel. Good sign, or bad sign? For the immediate future, it’s a good sign. But, sometimes, what used to be support can become resistance. The line halfway between the bottom of the channel and the channel baseline acted as resistance on August 5th, 2024. Now, that line is at the $580-ish range. Will it get rejected there? I don’t know, but it does make it an important area of interest. Especially, considering it is where the “neckline” of the double-top formation was broken.
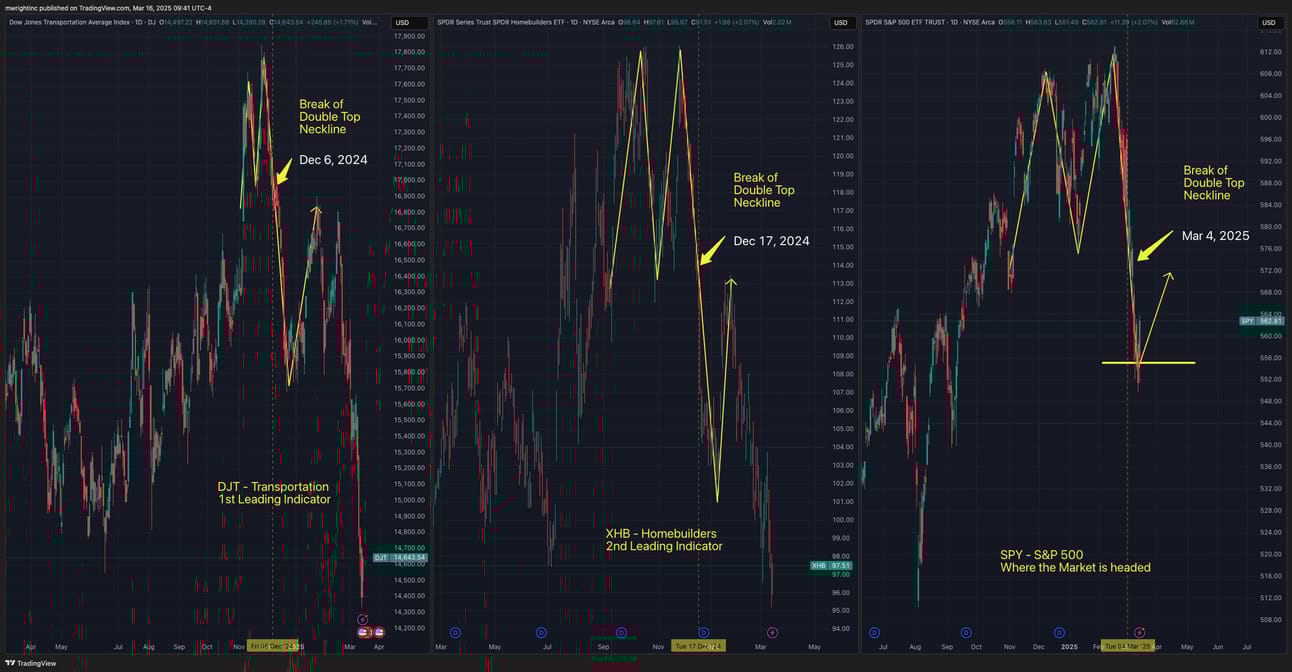
$SPY Following $DJT and $XHB
Before you get your hopes up about this little bounce, consider that the charts for $XHB, and especially $DJT, are showing some deep rooted problems. The precipitous drop for $DJT has continued, with no end in sight, and $XHB seems to be ready to follow. This was after they both bounced following drops from their own double tops back in December of 2024. If these are any indication, $580 might be the highest price we’ll see for $SPY for a long time. If, it can even get all the way back to there.
So, look for $SPY to return to $575-$580, and reject from there.
More Resources
Free TradingView indicators you can use right now in your account. Don’t have a TradingView account. Click this link to get one.
Magic Order Blocks [MW] https://www.tradingview.com/script/mC37KVoz-Magic-Order-Blocks-MW/
QQQ and SPY Price Levels [MW] https://www.tradingview.com/script/uthqQCwb-QQQ-and-SPY-Price-Levels-MW/
Magic Linear Regression Channel [MW] https://www.tradingview.com/script/qm2pmUW4-Magic-Linear-Regression-Channel-MW/
ATR Bands (Keltner Channel), Wick and SRSI Signals [MW] https://www.tradingview.com/script/lH6Yze4x-ATR-Bands-Keltner-Channel-Wick-and-SRSI-Signals-MW/
Bollinger Band Wick and SRSI Signals [MW] https://www.tradingview.com/script/cqTYgepJ-Bollinger-Band-Wick-and-SRSI-Signals-MW/
Price and Volume Stochastic Divergence [MW] https://www.tradingview.com/script/jnsqx9W9-Price-and-Volume-Stochastic-Divergence-MW/
Multi VWAP from Gaps [MW] https://www.tradingview.com/script/EqIgibII-Multi-VWAP-from-Gaps-MW/
Multi VWAP [MW] https://www.tradingview.com/script/L8cxNVC7-Multi-VWAP-MW/
MW Volume Impulse https://www.tradingview.com/script/c8A2cQb7-MW-Volume-Impulse/
The End
If you like this newsletter, let me know, and please share. If you don’t like it, please tell me why, and I’ll do my best to make it better. And remembre, if you have any questions, feel free to reach out to me on Reddit, X.com, TradingView, or Youtube. If for some reason you forget, you can always get those details from the footer at mwright.com