- Trading Advice for Losers
- Posts
- Buy Low, Sell High
Buy Low, Sell High
The most annoying trading advice ever given.
Mo Wright
March 02, 2025
⭐ Join our subscriber community at mwright.com ⭐
Introduction
Welcome. In this issue we’ll be covering some basic information that every trader should know. If you’re reading this, it’s because, like me, you’ve lost a few trades in the past. Or, more than likely, you’ve probably blown up an account or two. Again, like me.
I am not an expert, and you should not treat any of what is said in this newsletter as financial advice. It’s just my opinion. The opinion of an average trader that has had some success, and many failures.
What makes my opinion different, though, is that I’ve spent the last two years coding trading indicators and strategies full-time to supplement my own trading. And, I’ve been building apps and websites since the browser was invented.
You can access all of the tools that I’ve built at https://mwright.com. Indicators. Calculators. Strategies. Browser extensions. Etc.
Social media quote of the week:
“I originally came to be surrounded by like-minded people, but come to find out, most people here are newbies with a gambling addiction echoing the same nonsense over and over to newer newbies. Now I'm just on here for entertainment purposes.
I don't mind helping newbies, but I only help those who post well researched, constructive posts that show they are serious and have already done their due diligence.
Those who post asking the most basic things that a simple google search can answer or those posts where they want to announce they are quitting (thinking they are a main character and the rest of us NPCs will miss them), I poke fun at.”
Stock(s) To Watch
$ARIS - Aris Water Solutions
Strong multi-year uptrend. It’s at the top of it’s ATR band though. Wait for consolidation and/or a pullback, then this might be a solid long-term hold.

How To Trade Your First $1000. My Advice, buy low and sell high.
That was probably the worst advice I’ve ever heard. What the hell does “buy low” even mean. As I learned more, though, I started to find that “buy low” does have a very specific meaning. It’s just different for different people. It’s different for different timeframes. It’s different for different equities.
Regardless of all of those conditions, there are some general rules for defining what “low” is.
For starters, for long positions, it’s better to assume that you want to buy low when there’s a prevailing uptrend. That’s when equity prices “bounce” further up.
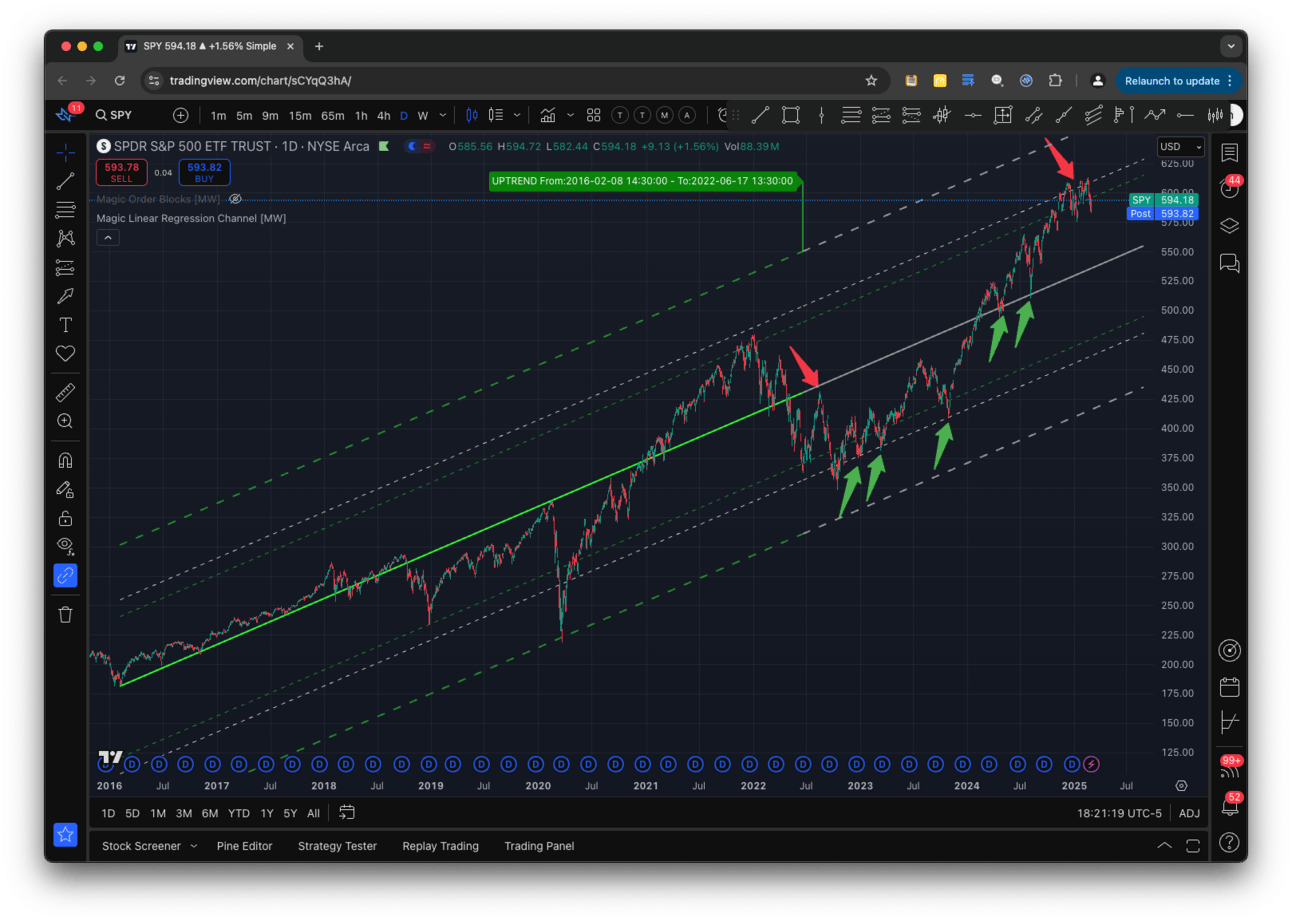
$SPY “bouncing” in a decade+ long projected channel
‘“Bounce” off of what?’ I would wonder in my fresh, young, impressionable, beginner trader mind. It could be
A moving average
The bottom of a parallel channel
Off of a trend line
Off of a support or supply level
Off of a round number
Off of a VWAP or AVWAP line
Off of an order block
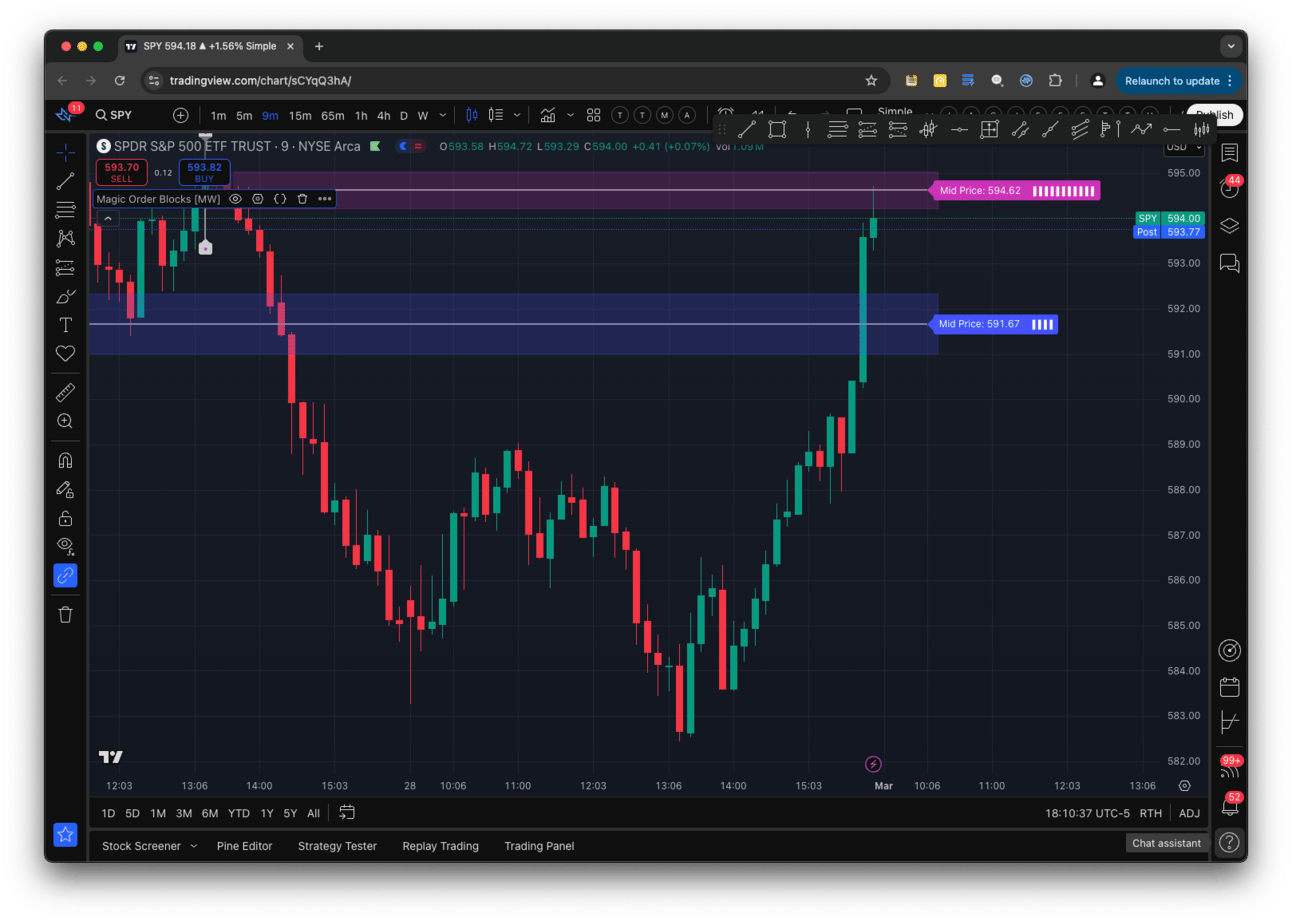
$SPY Running into resistance at an order block
The mistake I made as I began my trading journey was to believe that the indicator I just learned about was most important, when, in reality, each “might” matter more under certain conditions. For a new trader, seeing 3 bounces on a moving average means that it’s going to do that forever, but you quickly realize that it doesn’t. That is until you see 5+ bounces on the 9 or 8 exponential moving average, and then you’re back to believing that it’ll just keep going. Which, of course, it doesn’t.
And then there is the fact that elite traders don’t use charts at all. They’ll have an “order tree” that tells them the last prices where large buyers and sellers were present. Then, they buy at that point.
If you’re a relatively new trader, you may not know what any of that means. And, for that reason, it’s important to educate yourself aggressively, and seek out a mentor. Even if it means having to listen to the mean people on Reddit slam your bad decisions. There are white knights there too. The r/Daytrading subreddit is a great example of a carrot and stick type of feedback model. Sometimes, we need a virtual smack to get out of our bad habits, and have someone around that can show us what the good ones are.
In future newsletters I’ll go more into detail about some of these “bounce” levels and show you what tools to use in order to easily visualize them. However, if you don’t know what they are, and can’t wait until then, this might be a good time to aggressively educate yourself.
Analysis
$NVDA 2025.02.28
Many times, charts are not this cut and dry. But, as you can see from the chart, $NVDA is once again bouncing from a Fibonacci band within a multi-year channel. There is, however, a head-and-shoulders pattern that has formed. What that means is that at some point people were excited about the stock a pushed to a new high. Then people were excited again, but the price wouldn’t go as high as before. Sometimes, this can be a bearish indicator.
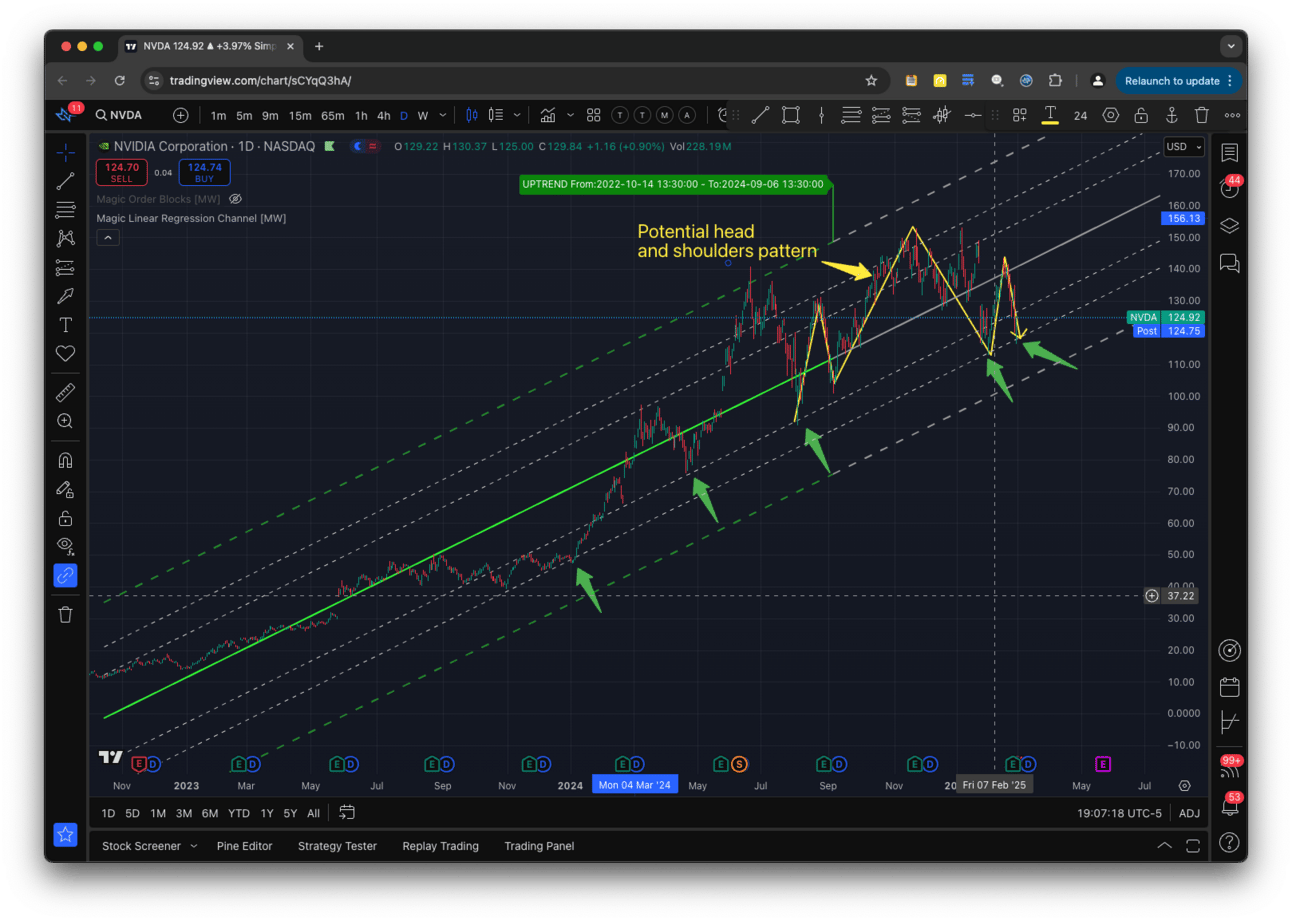
$NVDA long-term channel bounces using Magic Linear Regression Channel [MW]
Today’s aggressive move back up may be the reverse in direction that’s needed to undo the month of red that we’ve been seeing. But, we’re not out of the woods yet. Looking at the 1 hour chart there still seems to be a lot of resistance at $135 and $141, but that doesn’t mean we can’t get there with a nice 7% move (or 21% if you trade the leveraged $NVDU ETF). My best guess is that it has the potential to get back to that $135 level, but after that we could continue to see consolidation.
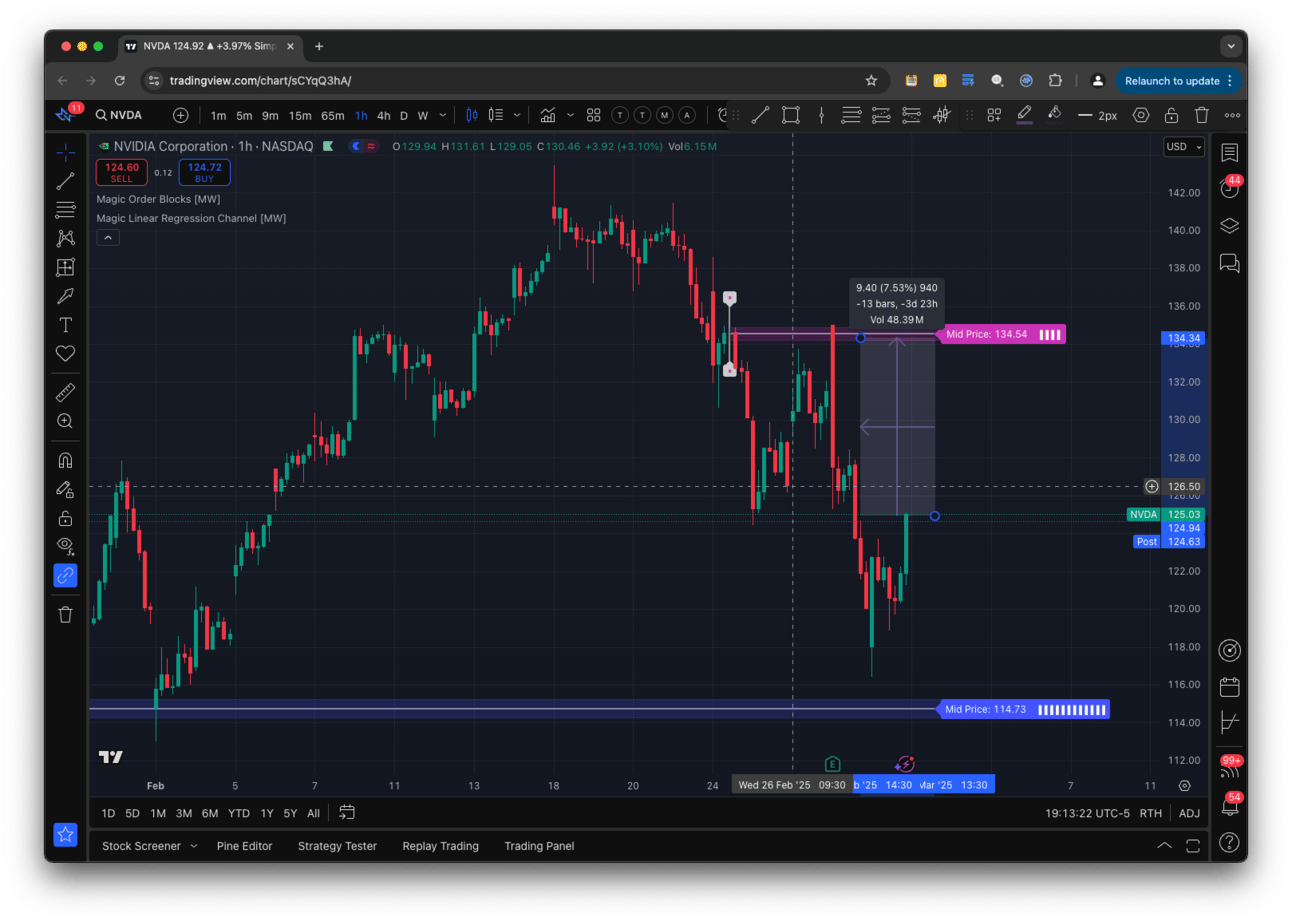
$NVDA 1 hour Chart With Magic Order Blocks [MW]
More Resources
Free tools that you can use today to enhance your trading journey.
Free TradingView indicators you can use right now in your account. Don’t have a TradingView account. Click this link to get one.
Magic Order Blocks [MW] https://www.tradingview.com/script/mC37KVoz-Magic-Order-Blocks-MW/
QQQ and SPY Price Levels [MW] https://www.tradingview.com/script/uthqQCwb-QQQ-and-SPY-Price-Levels-MW/
Magic Linear Regression Channel [MW] https://www.tradingview.com/script/qm2pmUW4-Magic-Linear-Regression-Channel-MW/
ATR Bands (Keltner Channel), Wick and SRSI Signals [MW] https://www.tradingview.com/script/lH6Yze4x-ATR-Bands-Keltner-Channel-Wick-and-SRSI-Signals-MW/
Bollinger Band Wick and SRSI Signals [MW] https://www.tradingview.com/script/cqTYgepJ-Bollinger-Band-Wick-and-SRSI-Signals-MW/
Price and Volume Stochastic Divergence [MW] https://www.tradingview.com/script/jnsqx9W9-Price-and-Volume-Stochastic-Divergence-MW/
Multi VWAP from Gaps [MW] https://www.tradingview.com/script/EqIgibII-Multi-VWAP-from-Gaps-MW/
Multi VWAP [MW] https://www.tradingview.com/script/L8cxNVC7-Multi-VWAP-MW/
MW Volume Impulse https://www.tradingview.com/script/c8A2cQb7-MW-Volume-Impulse/
The End
If you like this newsletter, let me know, and please share. If you don’t like it, please tell me why, and I’ll do my best to make it better.