- Trading Advice for Losers
- Posts
- A Trading Spreadsheet with Superpowers
A Trading Spreadsheet with Superpowers
The PositionSizeCalculator.net Companion Spreadsheet
Mo Wright
July 14, 2025
⭐ Join our subscriber community at mwright.com ⭐
Introduction
Welcome back. In this issue, I’m introducing a brand new product, and we’ll also do a deeper dive than usual into our weekly stock picks. Thanks for returning and get ready for a treat.
A Trading Spreadsheet with Superpowers
You guys have seen me share screenshots here from time-to-time where I have my stocks listed in a spreadsheet. Tracking your trades can be one of the most frustrating and time-consuming processes if you’re trying to figure it out on your own - which I did. And here it is: https://spreadsheet.positionsizecalculator.net

But, if there is one trait that successful traders share, it’s that they use spreadsheets. There are other more sophisticated and targeted trading tools for tracking and journaling, but nothing beats the simplicity and accessibility of something like Excel or Google Sheets. When you think about it, 3 of the top 10 companies in the S&P 500 have spreadsheets in their product line. $AAPL, $MSFT, $GOOGL.
But, building one from scratch, specifically for your trading style takes time and effort. It would have been great if someone had said to me “Use this tool. It’s a basic spreadsheet template that will help you…”
Organize your trade entries
Watch the performance of your current trade positions
Show you how you performed in your exits
Give you the tools to export lists of the stocks that you’re watching, that you’ve bought, and that you’ve sold
Let you go straight to the TradingView Superchart
Compare your portfolio’s performance to the industry standard, the S&P 500
And then some
No one ever said that to me. Probably because nothing like this existed. So, I built it. First, it was just a regular spreadsheet. Then, AI tools like Cursor.ai and ChatGPT hit the scene, giving me the power to supercharge it with automations of some of the more tedious spreadsheet processes. Stuff like:
Adding a row of ticker data without breaking any of the spreadsheet functions.
Getting a formatted list of tickers symbols, or rows of ticker data organized by account.
Getting a comma-delimited list of ticker symbols that I could import into a watchlist
I spent the last few weeks cleaning it up and making it ready for public consumption. I created some walk-through videos, and did a lot of debugging so that anyone could begin using it without much fuss.
Unlike my typical free tools, I plan on charging $19.95 for the spreadsheet. But, for my newsletter subscribers, you can access it for free for the next week (through July, 21 2025). Just DM me on TradingView on the user account @mwrightinc, or on Reddit on the user account @moluv00 for the details.
There’s even a convenient QR Code.

Go to the site. Watch the video. Support an independent developer, and get a copy.
Weekly Stock Picks: $AYASF
$AYASF appeared on the screener last week and looks like it has been bouncing from a lower Fibonacci level in its 5 year channel, and has room to hit either its baseline (+7%) or it’s high from last month (+15%). And it’s next bearish Magic Order Block [MW] is +23% away.
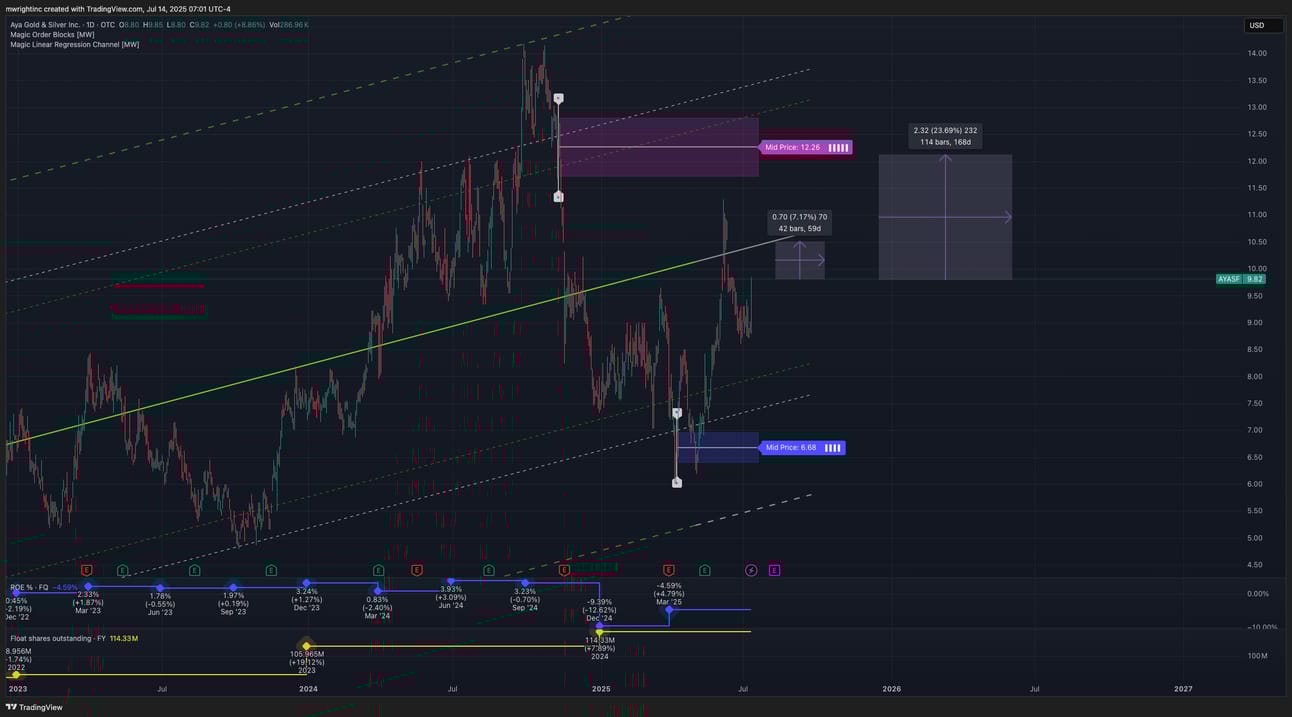
$AYASF with Magic Order Blocks [MW] and Magic Linear Regression Channel [MW]
I’m going to add this position Monday morning.
If that’s not enough for you, though, here are some other notables on from our screener: $GOLF, $HWKN, $SANM, $TTMI ( ▼ 13.2% )
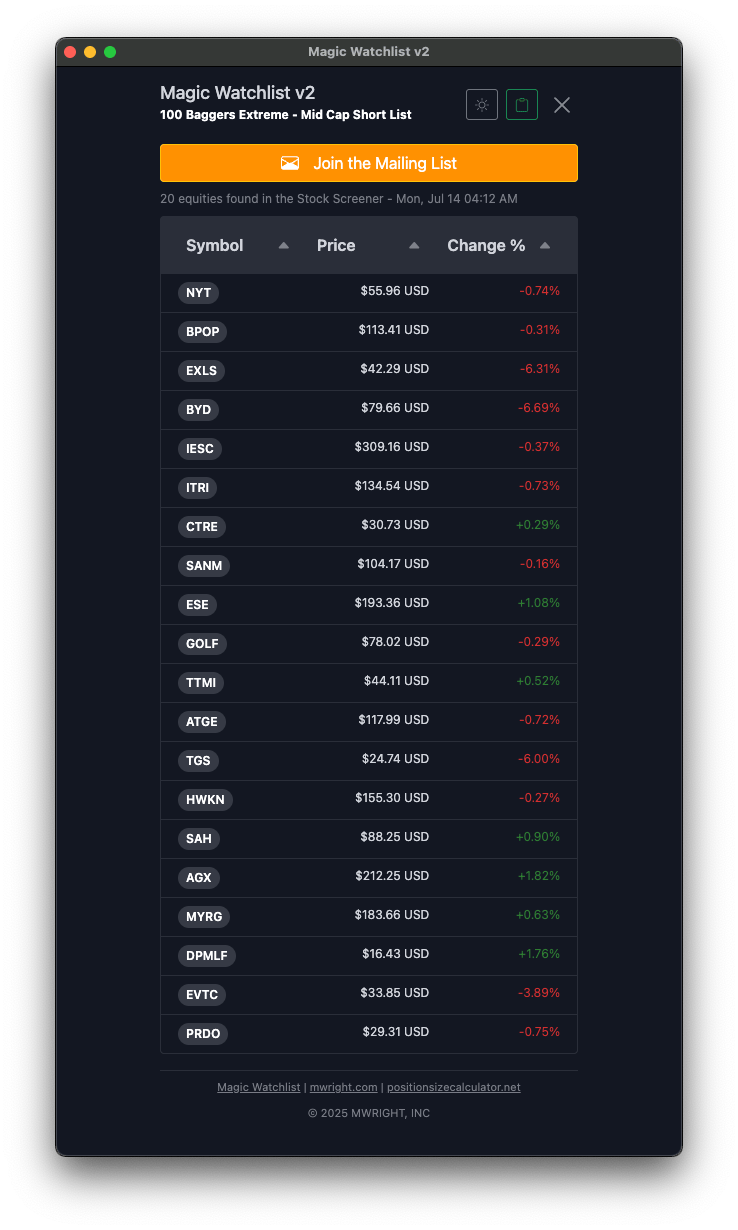
Magic Watchlist - 100 Baggers Extreme - Mid Cap Short List
Losers
Last week the markets turned on some of our up-and-coming small caps, so I had to cut a few. These included $BYRN (-9.64%), $SEZL (-9.35%), $TSSI (-10.54%), and $MVST (-6.23%).
$BYRN actually had a 2 day drop of 47.85%. I’m still not sure what caused it. Fortunately I got out, though, once it broke structure. Meaning, it stopped going upwards in its nice diagonal channel after it hit its resistance level from March. I was able keep 12.77% of the gains. All of this was after they announced earnings and beat everything.
2 things. Make sure you have stop losses set on your trades, or at least be able to monitor them closely for emergency exits. Also, StockTwits is a great resource to find out what’s going on with an individual stock. You can follow me there at user @moluv00.
$NEXN is down -12% from its highs from last month, so that may be next on the chopping block. It’s still a great position to have, and it hasn’t completely broken its structure. These are still all good stocks, and I may look to re-enter when they start showing signs of strength again.
But, a new wave of stocks are finding their legs.
From last week’s picks, $RSG on second look seems to have hit its ceiling in its 5 year channel. I’ll also rescind $RBC. It’s also at the top of a 15 year and 5 year Magic Linear Regression Channel [MW] and may not have a lot more room left to continue upwards. $SAPGF seems to be breaking down from the top of its 5 year channel. If it goes to its baseline, that would only be a 5% drop, then we’d look for strength after that. If it goes to the bottom of its channel, it would be a 17% drop. So, for this, I would wait for strength after it retraces to its baseline.
More Resources
Free tools that you can use today to improve your trading
Free TradingView indicators you can use right now in your account. Don’t have a TradingView account. Click this link to get one.
Other cool tools
The End
If you like this newsletter, let me know, and please share. If you don’t like it, please tell me why, and I’ll do my best to make it better. And remembre, if you have any questions, feel free to reach out to me on Reddit, X.com, TradingView, or Youtube. If for some reason you forget, you can always get those details from the footer at mwright.com