- Trading Advice for Losers
- Posts
- A Predictable Trading Pattern?
A Predictable Trading Pattern?
Using Magic Order Blocks [MW] with Magic Volume Oscillator PRO [MW]
Mo Wright
April 06, 2025
⭐ Join our subscriber community at mwright.com ⭐
Introduction
Welcome back. In this issue we’ll be sharing a new strategy using Magic Order Blocks [MW] and the soon to be released Magic Volume Oscillator PRO [MW] indicators. We’ll also be sharing a much needed review of $SPY.
I am not an expert, and you should not treat any of what is said in this newsletter as financial advice. It’s just my opinion. The opinion of an average trader that has had some success, and many failures.
What makes my opinion different, though, is that I’ve spent the last two years coding trading indicators and strategies full-time to supplement my own trading. And, I’ve been building apps and websites since the browser was invented.
You can access all of the tools that I’ve built at https://mwright.com. Indicators. Calculators. Strategies. Browser extensions. Etc.
Stocks of the Week: Hmmm…
Using our 100 Baggers filter on the TradingView Stock Screener page, there is only one stock that is above its 300, 200, 50, and 5-Day SMAs - $MVST. Its volume is declining following a strong upward move over the past week, which could either indicate sellers leaving or buyer exhaustion after nudging above its 4 month downward channel. Also, there is a Magic Order Block [MW] just above it at $2.29 (current price is $1.79. So, there is room for a potential 27% move, but it’s definitely not an A+ trade. Cash might be your best bet this week.
A Predictable Trading Pattern
I’ve found that price tends to move up when there is more buying than selling volume. Price tends to move down when there is more selling than buying volume. Also, price tends to move up when a selling vacuum occurs (sellers leave and selling volume ends abruptly), and price tends to move down when a buying vacuum occurs (buyers leave and buying volume ends abruptly). So, if there is some “overhead resistance” that is recognized by the masses, and volume begins to drop when the resistance is reached, and price begins to stall, it can be implied that a decrease in buying volume is causing the volume change. If volume continues to decrease, and price begins moving down, that means that a buying vacuum has been created, and then, even a small amount of selling pressure will bring price down. Under these conditions, the drop is even more pronounced when the resistance level occurs at a lower high.
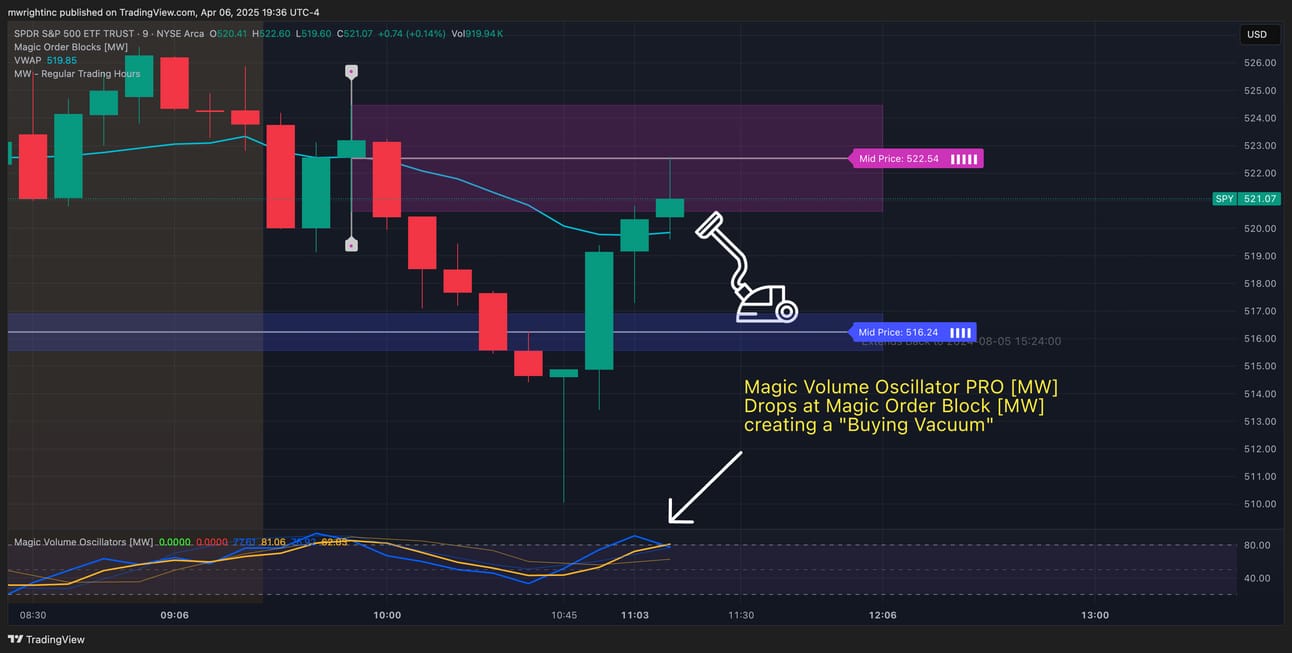
1. Magic Volume Oscillator PRO [MW] showing weakness at bearish Magic Order Block [MW] signaling a “Buying Vacuum”
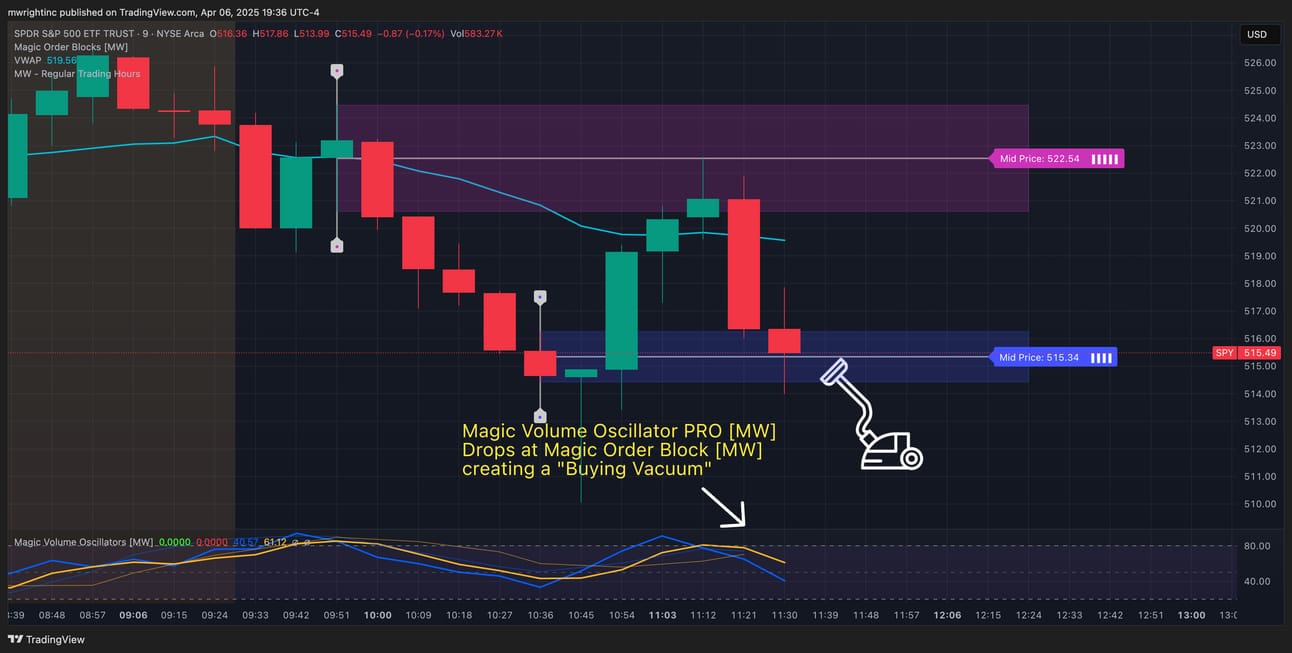
2. Buying vacuum pulls price down
Conversely, if volume is low, but begins to increase after a support level is reached, AND price starts to move up. It is likely a sign that buying volume is increasing, and the collective market is reacting to the support zone. This is even more pronounced during an uptrend when the support zone occurs and shows a higher low.
This all begs the question, “What’s the best way to identify support and resistance zones?” For that, we have the Magic Order Blocks [MW] indicator, that was presented in a detailed article 2 issues ago. The strongest of these typically coincide with Fibonacci levels on longer timeframes, which is why I include Fibonacci levels in the Magic Linear Regression Channel [MW] indicator. The next question, then, is “What’s the best way to know when volume is increasing or decreasing?” For that, we’ve nearly finished developing the Magic Volume Oscillator PRO [MW], which we’ve been testing for the past few months. It fundamentally uses a stochastic calculation of volume, which can clearly show the wave of volume changes much more clearly than a chart with raw volume numbers.
I also found that when small cap stocks go through a brief period of extremely high volume, order blocks and volume patterns become even more pronounced as signals. In the last newsletter, we went over “1 Day Rockets”. Using this methodology, I’ve been doing paper trades using this strategy for the past few weeks, and have not yet had a red day. You can view the post trade accounting for 4 of the last 5 days traded on the @mwright_com X.com account. (The missing day was just above breakeven). Or, you can check out the previous newsletter for transactions from the previous week.
The caveat for this method is that brokers have a much higher funding requirement for accounts in order to execute short trades. So, my paper trade accounts wouldn’t really count in real life since the account requirements would have exceeded my account size. However, I started testing the principal of the strategy with $SPY options - calls and puts - with success, so far.
$SPY Analysis
Our target of $510 by the end of April was spot-on, giving 2 straight weeks of targets hitting waaaay before their deadlines. $545 2-weeks ago following a move up to $570, and $510 last week.
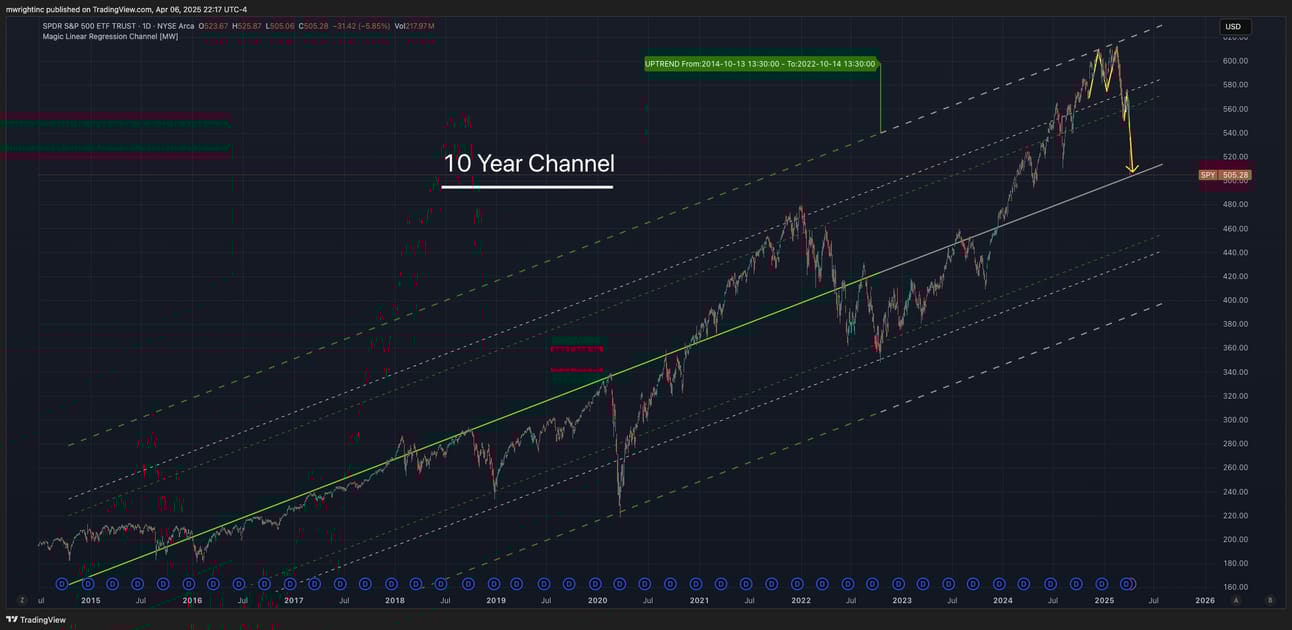
$SPY hitting the baseline of it’s 10-Year channel
On Friday, April 4th, 2025, $SPY hit the baseline of its 10 year channel. Will it slice through it like it did it’s 200 SMA? Although there are no bullish Magic Order Blocks [MW] on the $SPY daily chart, there is one that shows up on $SPX at around $SPY $500. If $SPY Continues to follow $DJT and $XHB we can expect a brief consolidation period, and maybe a “dead cat bounce” before we see another strong leg down. This is in line with the Magic Volume Oscillator PRO [MW] indicator showing that we’re at peak selling volume on the daily chart, which may indicate that seller’s may be ready to take a break.
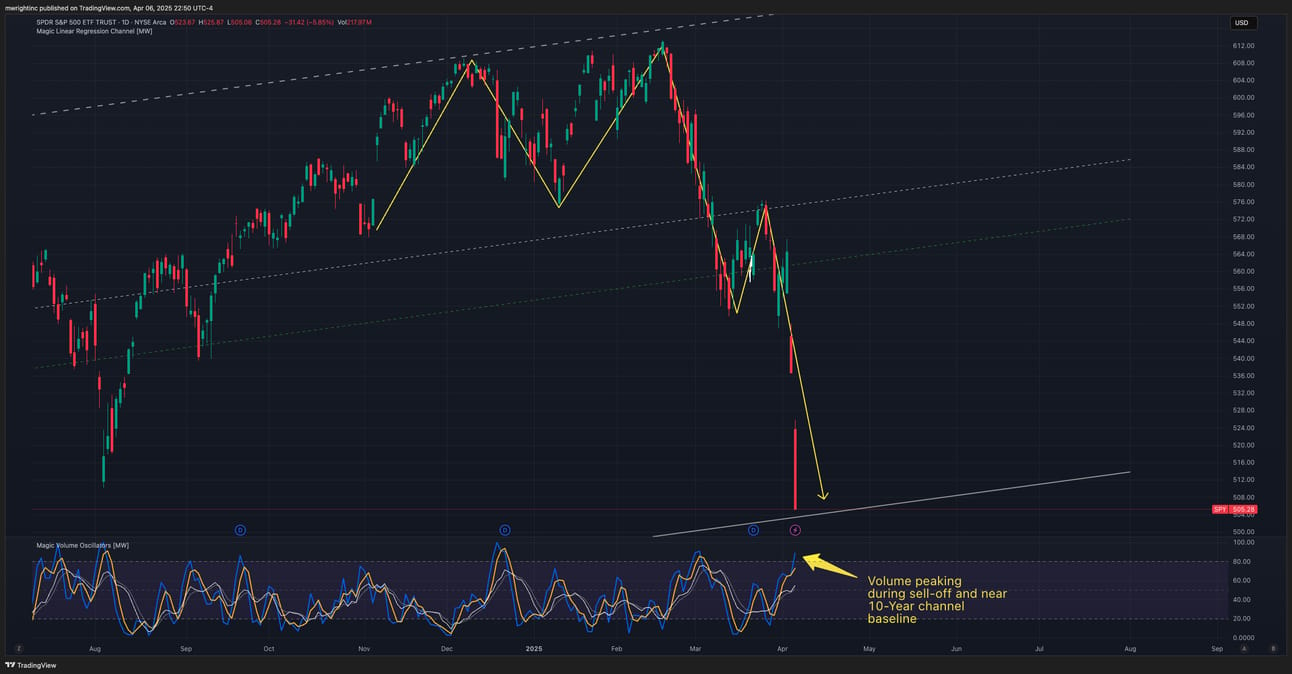
$SPY selling volume peaking
Once again, $DJT represents the Dow Jones Transportation index, which reflects corporate orders that impact shipping and logistics volume, while $XHB shows public interest in home buying. Both have continued to fall and $SPY has followed suit. Until these two stop showing weakness - which they haven’t - our expectation is that $SPY will continue to follow them down. As of this moment, $420, a Fibonacci level, and then $400, the bottom of the 10-year channel seem to be likely targets through April.
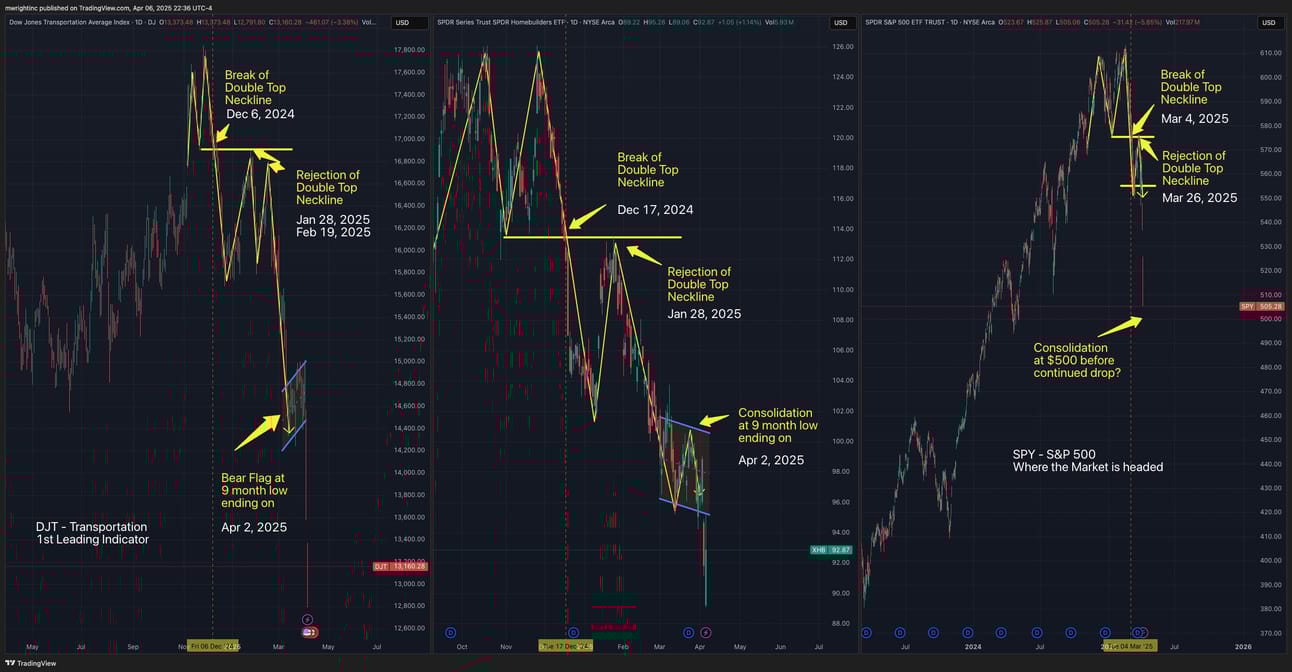
$DJT, $XHB, and $SPY
More Resources
Free TradingView indicators you can use right now in your account. Don’t have a TradingView account. Click this link to get one.
Magic Order Blocks [MW] https://www.tradingview.com/script/mC37KVoz-Magic-Order-Blocks-MW/
QQQ and SPY Price Levels [MW] https://www.tradingview.com/script/uthqQCwb-QQQ-and-SPY-Price-Levels-MW/
Magic Linear Regression Channel [MW] https://www.tradingview.com/script/qm2pmUW4-Magic-Linear-Regression-Channel-MW/
ATR Bands (Keltner Channel), Wick and SRSI Signals [MW] https://www.tradingview.com/script/lH6Yze4x-ATR-Bands-Keltner-Channel-Wick-and-SRSI-Signals-MW/
Bollinger Band Wick and SRSI Signals [MW] https://www.tradingview.com/script/cqTYgepJ-Bollinger-Band-Wick-and-SRSI-Signals-MW/
Price and Volume Stochastic Divergence [MW] https://www.tradingview.com/script/jnsqx9W9-Price-and-Volume-Stochastic-Divergence-MW/
Multi VWAP from Gaps [MW] https://www.tradingview.com/script/EqIgibII-Multi-VWAP-from-Gaps-MW/
Multi VWAP [MW] https://www.tradingview.com/script/L8cxNVC7-Multi-VWAP-MW/
MW Volume Impulse https://www.tradingview.com/script/c8A2cQb7-MW-Volume-Impulse/
The End
If you like this newsletter, let me know, and please share. If you don’t like it, please tell me why, and I’ll do my best to make it better. And remembre, if you have any questions, feel free to reach out to me on Reddit, X.com, TradingView, or Youtube. If for some reason you forget, you can always get those details from the footer at mwright.com